|
||||||||||||||||||||||||
|
||||||||||||||||||||||||
|
SHORT-TERM: COULD SEE REBOUND AS EARLY AS TOMORROW BUT THERE’LL BE A LOWER LOW AHEAD
Three things:
- C0uld see a rebound as early as tomorrow.
- Sell off might not be over yet, so today’s low is not the low.
- Trading wise, sell bounce is still the name of the game. See short-term model in the table above for more details.
Why I expect a rebound?
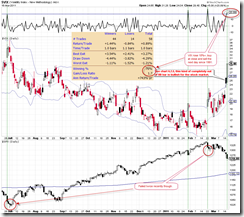
As mentioned in today’s After Bell Quick Summary, bulls have 76% chances tomorrow.
6.3.2a Major Distribution Day Watch, a Major Distribution Day (NYSE Down Volume : NYSE Up Volume >= 9) means 37/56 (66%) chances for bulls tomorrow.
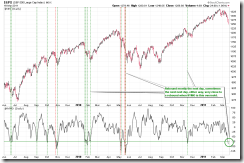
0.2.3 NYSE McClellan Oscillator, NYMO oversold is a very reliable signal, one of my favourite.
Why today’s low is not the low?
Very oversold NYMO means a VISIBLE positive divergence is a must before a meaningful bottom. What does VISIBLE mean? The index must rebound for a few days first then fall back below the previous low while NYMO hold above its previous low to form a positive divergence. Let’s say tomorrow, the index keeps selling off and we have a lower low then rebound huge, NYMO in this case may have a higher low, well, too bad, that is not a visible positive divergence. Must be a rebound (say, starting from tomorrow) for a few days then falls back below today or tomorrow’s low, whichever is lower, then we shall have the visible positive divergence.
Two Major Distribution Day within 2 days, so could see a short-term rebound (see dashed blue lines), could not (see dashed red lines), whichever the cases, the point is the sell off mostly continues thereafter.
INTERMEDIATE-TERM: COULD NOT BE VERY BRIGHT BUT STATISTICALLY BULLISH IN 3 TO 6 MONTHS
See 03/11 Market Recap for more details.
SEASONALITY: BULLISH MONDAY
According to Stock Trader’s Almanac:
- Monday before March Triple Witching, Dow up 17 of last 23.
- March Triple Witching Day mixed last 10 years, Dow down 3 of last 4.
For March seasonality chart please refer to 03/01 Market Recap.
HIGHLIGHTS OF THE OTHER ETFS IN MY PUBLIC CHART LIST
| TREND | COMMENT | |
| QQQQ&Weekly | UP | |
| IWM & Weekly | UP | |
| SSEC & Weekly | UP | |
| EEM & Weekly | DOWN | |
| XIU & Weekly | UP | 1.5.1 TSE McClellan Oscillator: Oversold. |
| TLT & Weekly | UP | |
| FXE & Weekly | UP | (weekly) Testing Fib confluences area. |
| GLD & Weekly | UP | |
| GDX & Weekly | UP | |
| USO & Weekly | UP | |
| XLE & Weekly | UP | |
| XLF & Weekly | UP | |
| IYR & Weekly | UP | |
| XLB & Weekly | DOWN | |
| DBA & Weekly | DOWN |
- Please make sure you understand how to use the table above. The purpose of this report is to provide info so contradictory signals are always presented.
- * = New update; Blue Text = Link to a chart in my public chart list.
- UP = Intermediate-term uptrend. Set when weekly buy signal is triggered.
- DOWN = Intermediate-term downtrend. Set when weekly sell signal is triggered.


