|
||||||||||||||||||||||||
|
||||||||||||||||||||||||
|
SHORT-TERM: BULLISH BIASED
Nothing to say today. The chart doesn’t look bad, could be a Bull Flag in the forming. My trading strategy is to buy on strength. Not sure if today’s dip is a buy, will see how market opens tomorrow to decide whether to be a bull or bear.
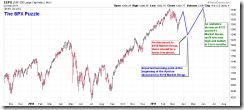
The chart below illustrated all the conclusions I made based on evidences so far I’ve collected. Should be more clear than I simply blah blah in Ch-English. For fun only though.
INTERMEDIATE-TERM: BULLISH IN 3 TO 6 MONTHS
Combine the study mentioned in 02/23 Market Recap and 03/11 Market Recap, I still believe that 02/18 high will be revisited.
SEASONALITY: BEARISH THE NEXT WEEK
According to Stock Trader’s Almanac:
- Week after Triple Witching, Dow down 15 of last 23, but rallied 4.9% in 2000, 3.1% in 2007 and 6.8% in 2009.
- March historically weak later in the month.
For March seasonality chart please refer to 03/01 Market Recap.
HIGHLIGHTS OF THE OTHER ETFS IN MY PUBLIC CHART LIST
| TREND | COMMENT | |
| QQQQ&Weekly | DOWN | |
| IWM & Weekly | UP | |
| SSEC & Weekly | UP | |
| EEM & Weekly | DOWN | |
| XIU & Weekly | UP | *ChiOsc is way too high. |
| TLT & Weekly | UP | |
| FXE & Weekly | UP | |
| GLD & Weekly | UP | |
| GDX & Weekly | 03/15 S | |
| USO & Weekly | UP | |
| XLE & Weekly | UP | |
| XLF & Weekly | DOWN | |
| IYR & Weekly | UP | |
| XLB & Weekly | DOWN | |
| DBA & Weekly | DOWN |
- Please make sure you understand how to use the table above. The purpose of this report is to provide info so contradictory signals are always presented.
- * = New update; Blue Text = Link to a chart in my public chart list.
- UP = Intermediate-term uptrend. Set when weekly buy signal is triggered.
- DOWN = Intermediate-term downtrend. Set when weekly sell signal is triggered.


