|
||||||||||||||||||||||||
|
||||||||||||||||||||||||
|
SHORT-TERM: COULD SEE SOME WEAKNESS AHEAD
Two cents:
- Not sure if there’s one more push up to new high but I believe a little bit bigger pullback is due soon.
- Trading wise, the strategy is still to buy dip unless bears could show us some real strength.
The arguments for calling a pullback are not solid enough so that’s why I’m not sure if there still is one more push up ahead.
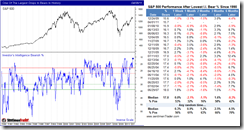
The chart below actually is more bearish than it appears. Except the possible Ending Diagonal Triangle mentioned in the After Bell Quick Summary, both RSI negative divergence and 3 push up pattern are actually more bearish signs.
T2122, NYSE 4 week new high/low ratio. It’s my ultimate weapon for detecting the overbought/oversold conditions. Although relative to the history, it’s not extreme enough but considering the fact that Russell 2000 is now at historical high therefore inevitably the new high could only be less and less (as more difficult to reach), thus chances for T2122 to reach a historical extreme become smaller and smaller, so the current reading should be high enough if not highest in the foreseeable future.
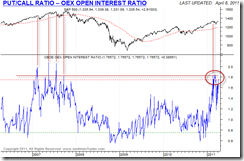
Take a look at what retailers are doing when at the same time, OEX option traders are buying huge amount of puts. ISEE Equities Only Index closed above 300 should be high enough within the top 5 readings of the ISEE history.
The two additional charts below are about the intermediate-term, info only.
INTERMEDIATE-TERM: BULLISH APRIL, SPX TARGET 1352 TO 1381, BEWARE 04/11 TO 04/14 PIVOT DATE
See 04/01 Market Recap for more details.
SEASONALITY: APRIL HAS BEEN HISTORICALLY THE MOST BULLISH MONTH OF THE YEAR
See 04/01 Market Recap for more details.
HIGHLIGHTS OF THE OTHER ETFS IN MY PUBLIC CHART LIST
| TREND | COMMENT | |
| QQQQ&Weekly | UP | |
| IWM & Weekly | UP | |
| SSEC & Weekly | UP | Ascending Triangle, so may go higher from here. |
| EEM & Weekly | UP | |
| XIU & Weekly | UP | |
| TLT & Weekly | UP | |
| FXE & Weekly | UP | |
| GLD & Weekly | UP | |
| GDX & Weekly | 04/05 L | |
| USO & Weekly | UP | |
| XLE & Weekly | UP | |
| XLF & Weekly | DOWN | |
| IYR & Weekly | UP | |
| XLB & Weekly | UP | |
| DBA & Weekly | DOWN |
- Please make sure you understand how to use the table above. The purpose of this report is to provide info so contradictory signals are always presented.
- * = New update; Blue Text = Link to a chart in my public chart list.
- UP = Intermediate-term uptrend. Set when weekly buy signal is triggered.
- DOWN = Intermediate-term downtrend. Set when weekly sell signal is triggered.


