|
||||||||||||||||||||||||
|
||||||||||||||||||||||||
|
SHORT-TERM: MAY SEE SOME WEAKNESS ON MONDAY BUT THERE’RE CHANCES THAT THE BOTTOM WAS IN
Three cents:
- Could see pullback next Monday, not sure though. And there’re some chances that the low was in, not sure either.
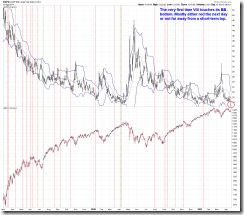
- VIX is at a key support, if breakdown decisively, then all time high for SPX is just matter of time. Bear’s hops is the very first time VIX touches BB bottom and TLT weekly Bullish Engulfing.
- Trading wise, up huge Monday, I’d be on the bull side. If Monday breaks below the Friday’s low and closes in red, then Cobra Impulse System’s short setup is confirmed and it’ll change into sell mode.
My evil plan for the next shows below.
- Why pullback? Because the ChiOsc is a little high. And SPY seldom breaks above EMA20 (pink curve) then never turns back, usually it will pullback below EMA20 at least one time.
- No confirmed lower low on RSP is my main reason to speculate that the bottom might already be in. Besides, will mention later that if the conventional support rule applies on VIX then chances are pretty low that the support would hold for the VIX this time.
The weekly chart below explains why VIX is now at key position. If breakdown, then it’s year 2006 and 2007 once more that SPX would skyrocket high from here. The theory about support is that the more tests on the support the weaker the support is because every test consumes partial buyers, and this is why, we see Double Bottom or Triple Bottom but never a Quadro-Bottom. The current VIX support has been tested more than 4 times, so if the support theory applies to VIX (which I’m not sure, as after all, VIX has no direct supply and demand relationships), then the chances are remote that the support would hold this time. This will be the bull’s biggest hope.
For bears, see chart below, the very first time VIX touches its BB bottom, either red the next Monday or SPX is not far away from a top, only a small chances that SPX simply never turned back, so if only the bear’s luck is not too bad, it at least has chance to escape.
Also, the TLT weekly Bullish Engulfing is very interesting, although 3 past cases are simply too few but from my experiences that the weekly Bullish Engulfing or Bearish Engulfing are usually very reliable signal.
The chart below is info only. I still think the VIX:VXV is way too low, but you can read it as a bullish sign because the previous 2 times when VIX:VXV this low, the market rallied huge thereafter.
Cobra Impulse System keeps yelling for short, need break the Friday’s low and eventually close in red the next Monday to confirm the short though.
INTERMEDIATE-TERM: BULLISH APRIL, SPX TARGET 1352 TO 1381, BEWARE 04/11 TO 04/14 PIVOT DATE
See 04/01 Market Recap for more details.
SEASONALITY: MIXED NEXT WEEK
Mixed seasonality for the next week. Feel free to choose whichever you’d like to believe, after all the market never goes wrong, so it doesn’t matter what you want to believe.
- 6.5.4a Seasonality - OE Week, as mentioned in the Friday’s After Bell Quick Summary, the week after a red OE week is mostly bearish.
- Bespoke claims the week after tax deadline is bullish.
- Seasonality around Good Friday from Sentimentrader, looks bullish everyday the next week.
- Schaeffer claims the 1st week of 5-week cycle is bearish.
- Stock Trader’s Almanac says, April prone to weakness after tax deadline but NASDAQ up 14 of 16 day before Good Friday, 10 straight since 2001.
HIGHLIGHTS OF THE OTHER ETFS IN MY PUBLIC CHART LIST
| TREND | COMMENT | |
| QQQ & Weekly | UP | |
| IWM & Weekly | UP | |
| SSEC & Weekly | UP | |
| EEM & Weekly | UP | |
| XIU & Weekly | *DOWN | |
| TLT & Weekly | *UP | |
| FXE & Weekly | UP | |
| GLD & Weekly | UP | |
| GDX & Weekly | 04/14 S | |
| USO & Weekly | UP | |
| XLE & Weekly | UP | |
| XLF & Weekly | DOWN | |
| IYR & Weekly | UP | |
| XLB & Weekly | UP | |
| DBA & Weekly | *DOWN |
- Please make sure you understand how to use the table above. The purpose of this report is to provide info so contradictory signals are always presented.
- * = New update; Blue Text = Link to a chart in my public chart list.
- UP = Intermediate-term uptrend. Set when weekly buy signal is triggered.
- DOWN = Intermediate-term downtrend. Set when weekly sell signal is triggered.


