|
||||||||||||||||||||||||
|
||||||||||||||||||||||||
|
SHORT-TERM: SHOULD BE MORE ON THE UPSIDE, BEWARE OF VIX BB SELL SETUP THOUGH
Three cents:
- Should be more on the upside.
- Beware of VIX.
- I’ll buy the very first dip if any.
Generally, a huge up day like today won’t simply fade right away, so there should be more on the upside and I sure hope that this time the 2 pending prophecies could finally be fulfilled:
- 02/23 Market Recap, new high within 69 calendar days on average whenever there’re 2.5%+ pullbacks from a 40+ straight up days.
- 1.2.0 INDU Leads Market.
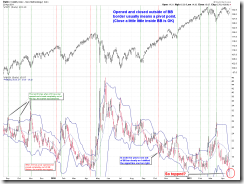
The short-term risk is still the VIX. The charts below are all about the story of VIX and its BB. Looks odds are not too bad for bears, so if the market up huge again tomorrow beware of the risk of the next Monday as according to Stock Trader’s Almanac, day after Easter, worst post-holiday, S&P down 16 of 20 from 1984 to 2003, but improving recently, up 6 of last 7, including 1.5% gain in 2008.
Another risk is IBM closed in red today. The screenshot below is from Bespoke. The data is old, but if I remember correctly, all the recent IBM ER (not included in the screenshot below) did successfully predict the SPX future prices. It’s not a short-term risk of course, but I suggest to pay attention to the oil price as if anything can bring this market down, it’s more likely the oil price.
INTERMEDIATE-TERM: BULLISH APRIL, SPX TARGET 1352 TO 1381, BEWARE 04/11 TO 04/14 PIVOT DATE
See 04/01 Market Recap for more details.
SEASONALITY: MIXED
See 04/15 Market Recap for more details.
HIGHLIGHTS OF THE OTHER ETFS IN MY PUBLIC CHART LIST
| TREND | COMMENT | |
| QQQ & Weekly | UP | |
| IWM & Weekly | UP | |
| SSEC & Weekly | UP | |
| EEM & Weekly | UP | |
| XIU & Weekly | DOWN | |
| TLT & Weekly | UP | |
| FXE & Weekly | UP | |
| GLD & Weekly | UP | |
| GDX & Weekly | 04/18 L | |
| USO & Weekly | UP | |
| XLE & Weekly | UP | |
| XLF & Weekly | DOWN | |
| IYR & Weekly | UP | |
| XLB & Weekly | UP | |
| DBA & Weekly | DOWN |
- Please make sure you understand how to use the table above. The purpose of this report is to provide info so contradictory signals are always presented.
- * = New update; Blue Text = Link to a chart in my public chart list.
- UP = Intermediate-term uptrend. Set when weekly buy signal is triggered.
- DOWN = Intermediate-term downtrend. Set when weekly sell signal is triggered.


