|
||||||||||||||||||||||||
|
||||||||||||||||||||||||
|
SHORT-TERM: COULD SEE SOME WEAKNESS AHEAD
Three cents:
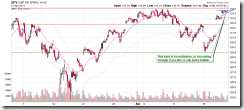
- Could see another gap up Monday (or at least higher high), but the day may close in red.
- Could see pullback soon, the mini target is to close below the 04/20 closes.
- If the pullback is not strong, then it’s a good chance to load longs.
Why gap up Monday but eventually in red? I’ve explained this in Thursday’s After Bell Quick Summary. Chart pattern wise, there should be one more push up but the recent price actions after a high NYADV readings argue for a red Monday.
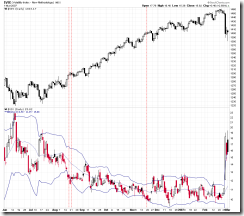
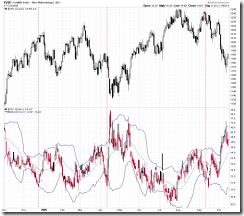
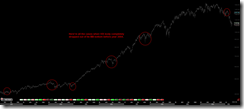
About the expected pullback, the major argument is still the VIX dropped below BB bottom. I’ve told a few stories about VIX and BB in 04/20 Market Recap and they’re still valid. Listed below are all the past cases when VIX body completely dropped out of BB bottom (means both open and close are below BB bottom). Before year 2004, StockCharts has only VIX close prices, so I can only show the detailed charts here up to year 2004. But anyway, it should be clear, 100% chances SPX will close below its 04/20 close soon. If you paid a little more attention (other than I blah blah), you’d notice that there’re good chances the pullback won’t be small, so the possibilities that we’re at an intermediate-term top now cannot be excluded. Personally, as of now (subject to change as always) I think such a possibility is low, the reasoning is, the past 3 days rebound was very strong, rarely they fail immediately, besides, the intermediate-term session below will prove that QQQ weekly Bullish Engulfing is very bullish.
INTERMEDIATE-TERM: SPX TARGET 1352 TO 1381
For 2 reasons, I’d like to maintain the intermediate-term price target mentioned in 04/01 Market Recap.
Could be a Symmetrical Triangle in the forming which is a very common wave 4 pattern, so this proves that the price target calculated based on wave 5 is logical. For how I got the price target, please refer to 04/01 Market Recap.
Another reason is QQQ weekly Bullish Engulfing. See back test below, highlighted in green are all weekly Bullish Engulfing cases, buy at Friday’s close sell 1, 2, 3, 4, 5, 6 week later, looks very bullish both statistically and visually. The same back test on SPY, by the way, doesn’t have such astonishing effect but it’s not bearish and considering the weakness we saw on Financials sector recently, my guess is QQQ will outperform SPY in the coming days.
SEASONALITY: BEARISH MONDAY, THURSDAY AND FRIDAY, BULLISH WEDNESDAY
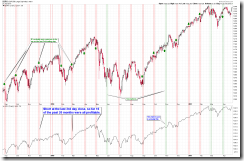
According to Stock Trader’s Almanac, day after Easter, worst post-holiday, S&P down 16 of 20 from 1984 to 2003, but improving recently, up 6 of last 7, including 1.5% gain in 2008.
6.5.2b Seasonality – Last Few Days of the Month, could be bearish Thursday and Friday but bullish Wednesday.
HIGHLIGHTS OF THE OTHER ETFS IN MY PUBLIC CHART LIST
| TREND | COMMENT | |
| QQQ & Weekly | UP | |
| IWM & Weekly | UP | |
| SSEC & Weekly | UP | |
| EEM & Weekly | UP | |
| XIU & Weekly | DOWN | |
| TLT & Weekly | UP | |
| FXE & Weekly | UP | |
| GLD & Weekly | UP | |
| GDX & Weekly | 04/18 L | |
| USO & Weekly | UP | |
| XLE & Weekly | UP | |
| XLF & Weekly | DOWN | |
| IYR & Weekly | UP | |
| XLB & Weekly | UP | |
| DBA & Weekly | DOWN |
- Please make sure you understand how to use the table above. The purpose of this report is to provide info so contradictory signals are always presented.
- * = New update; Blue Text = Link to a chart in my public chart list.
- UP = Intermediate-term uptrend. Set when weekly buy signal is triggered.
- DOWN = Intermediate-term downtrend. Set when weekly sell signal is triggered.

