SHORT-TERM: NEW HIGH THEN MORE PULLBACK?
Canada election day today, need vote before 9:30pm ET, so no time to think carefully about all the evidences I’ve collected, sorry.
Three cents:
- Should be more new highs ahead but also good chances we’ll see a pullback that could last for a few days. My guess is new high first then more pullbacks.
- Still think Dollar was (or close to) bottomed, at least for a short-term.
- Trading wise, the name of the game still is to buy dip.
Why should be more new highs ahead? Because the RSI in chart 1.0.0 S&P 500 SPDRs (SPY 60 min) hit new high again today. For detailed explanation please refer to 04/29 Market Outlook.
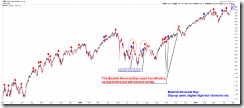
Why chances are good that we’ll see a pullback that could last for a few days? Because a bearish reversal bar is formed on the SPY daily chart. This kind of pattern WAS reliable, just it may take a few days before the real pullbacks and this is why I guess that we could see a new high first. Just a wild guess, not sure.
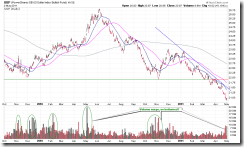
Why was Dollar bottomed? Just take a look at what happened in the past when UUP volume surged.
0.2.4 Nasdaq Total Volume/NYSE Total Volume, I don’t know what’s going on here. Theoretically, it should mean that the market was bottomed. For the similar reason mentioned in the 04/29 Market Outlook, I’m not sure if it really means a bottom as I was not sure if it really meant a top on 04/29.
INTERMEDIATE-TERM: SPX NOW IN 1352 TO 1381 WAVE 5 PRICE TARGET AREA, WATCH FOR POTENTIAL REVERSAL
See 04/27 Market Outlook for more details.
SEASONALITY: BULLISH MONDAY AND FRIDAY
See 04/29 Market Outlook for more details. For May seasonality day by day also see 04/29 Market Outlook.
ACTIVE BULLISH OUTLOOKS:
- 09/27 Market Recap: 9 POMO within 20 trading days means 14%+ up in 3 months.
- 03/11 Market Recap: Bullish in 3 to 6 months.
- 04/21 Market Recap: QQQ weekly Bullish Engulfing is bullish for the next 6 weeks.
ACTIVE BEARISH OUTLOOKS:
- 04/21 Market Recap: SPX will close below 04/20 close soon.
HIGHLIGHTS OF THE OTHER ETFS IN MY PUBLIC CHART LIST:
|
||||||||||||||||||||||||||||||||||||||||||||||||||||||||||||
|


