SHORT-TERM: MAY SEE REBOUND AS EARLY AS TOMORROW BUT THE PULLBACK IS NOT OVER YET
Three cents:
- The pullback is not over yet although I cannot exclude the possibilities that starting from tomorrow we’ll see a really huge rebound.
- Tomorrow is Non Farm Payroll day. The intraday pattern is open high close lower or open low close higher. For more details, please check here.
- Trading wise, even the low was in today (as I said above that I cannot exclude this possibility), at least very short-term there’s one chance to sell the bounce so bears should have enough time to escape unharmed.
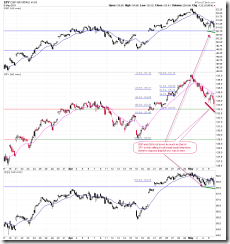
Why cannot exclude the possibility that we’ll see a huge rebound starting from tomorrow? I’ve give enough reasons in today’s Trading Signals, please take a look. I’m not sure if the rebound will start exactly tomorrow though but should be soon. Well, better rebound tomorrow, otherwise I’d have a bad news in the weekend report. The chart below shows another reason for calling a rebound because RSP and QQQ didn’t confirm the SPY action today. The same argument in the past would mean the low was in, just for now, because of the huge rebound of the Dollar, commodity index is badly damaged which should lead to more selling ahead and therefore would be the headwind to the stock market. So although I cannot exclude the possibilities that the low was in today but I simply need more evidences.
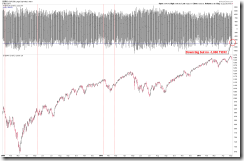
Then why isn’t the pullback over? Because, apparently, people were happily buying the dips today while the market was down sharply. How do I know? Well, for almost a 1% down day but simply there wasn’t a single –1,000 TICK readings which means no panic selling yet. The previous 4 times when the same thing happened was on 02/23/2010, 01/12/2010, 05/11/2009 and 01/09/2009. Take a look at what happened thereafter? The most bullish one was 02/23/2010, but even so, bear still got one day to escape and this is why I said to sell bounce should be OK even though I cannot exclude the possibilities that the low was in.
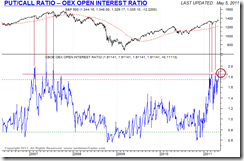
Another reason I think the pullback isn’t over is that OEX Open Interest Ratio kept rising today.
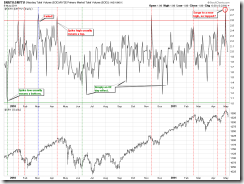
The last but not the least. A reader asked yesterday why didn’t I mention the bottom signal given by 0.2.4 Nasdaq Total Volume/NYSE Total Volume (NATV/NYTV)(see 05/02 Market Outlook) anymore? Well, because the signal appears to be a data error, see chart below. If no such a data error on 05/02, then the 05/02 bearish reversal day plus 04/29 NATV/NYTV Ratio surge should be enough to call the top, no need to wait until 05/04 for CPCE trend line breakout confirmation. NATV/NYTV surge plus SPX down 3 consecutive days plus CPCE trend line broken are very powerful topping combinations, by the way. Well, too late to say this now…
INTERMEDIATE-TERM: SPX NOW IN 1352 TO 1381 WAVE 5 PRICE TARGET AREA, WATCH FOR POTENTIAL REVERSAL
See 04/27 Market Outlook for more details.
SEASONALITY: BULLISH MONDAY AND FRIDAY
See 04/29 Market Outlook for more details. For May seasonality day by day also see 04/29 Market Outlook.
ACTIVE BULLISH OUTLOOKS:
- 09/27 Market Recap: 9 POMO within 20 trading days means 14%+ up in 3 months.
- 03/11 Market Recap: Bullish in 3 to 6 months.
- 04/21 Market Recap: QQQ weekly Bullish Engulfing is bullish for the next 6 weeks.
ACTIVE BEARISH OUTLOOKS:
- 04/21 Market Recap: SPX will close below 04/20 close soon.
05/04 Market Outlook: At least a short-term top could have been in.
HIGHLIGHTS OF THE OTHER ETFS IN MY PUBLIC CHART LIST:
|
||||||||||||||||||||||||||||||||||||||||||||||||||||||||||||
|


