SHORT-TERM: COULD SEE MORE REBOUND FOR A FEW DAYS BUT 90% CHANCES THE NEXT WEEK WILL CLOSE IN RED
Why more rebound? Because VIX has been up 6 consecutive days (thanks for a reader reminding me). See back test below, VIX up 5 consecutive days, buy at SPX at close (that’s 05/05, not 05/06), sell 1, 2, 3, 5, 10 and 20 days later since year 2003, clearly we can see it’s bullish for the next couple of days. However, not much edge in the next couple of weeks and this also means what I’m going to say the next is worth a little that IWM weekly Bearish Engulfing could mean bearish in the next couple of weeks.
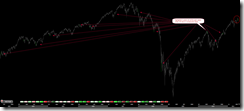
The chart below is for fun only. I’ve already mentioned in 05/06 Intraday Comment that bears should be careful about the potential Monday huge rally. Personally, I think there’re some differences between the black we have not and that of then, so the chances for yet another 16 points gap up Monday (like what happened then) is a little little little lower.
Why could the next week eventually close in red? Because the back test below shows that IWM weekly Bearish Engulfing are bearish for the next couple of weeks.
Another evidence arguing for a bearish next couple of weeks is from Schaeffer.
0.0.2 Combined Intermediate-term Trading Signals, just a reminder. I’m not sure if the CPCE:RSP bearish crossover is a whipsaw so I’d prefer to wait for a few days. The bearish crossover, if confirmed later, would mean that Non-Stop Model is officially in the sell mode.
INTERMEDIATE-TERM: SPX NOW IN 1352 TO 1381 WAVE 5 PRICE TARGET AREA, WATCH FOR POTENTIAL REVERSAL
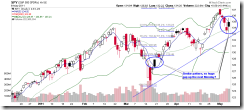
The SPX happens to have formed a Dark Cloud Cover, which has 60% chances leads to a bearish reversal, in the potential wave 5 target area I mentioned in 04/01 Market Recap, so now we must watch carefully. If the market drops sharply in the next few weeks especially below the 03/16 lows then chances are good that the bearish wave count shown in the chart below would turn out to be deadly right, which in another word means the primary wave 3 down could have already been on the way. For now, it’s just an attention, not even a warning though, I just want you to know the story, that’s it.
SEASONALITY: BULLISH MONDAY
According to Stock Trader’s Almanac, Monday after Mother’s Day, Dow up 12 of last 15.
For May seasonality day by day please refer 04/29 Market Outlook.
ACTIVE BULLISH OUTLOOKS:
- 09/27 Market Recap: 9 POMO within 20 trading days means 14%+ up in 3 months.
- 03/11 Market Recap: Bullish in 3 to 6 months.
- 04/21 Market Recap: QQQ weekly Bullish Engulfing is bullish for the next 6 weeks.
ACTIVE BEARISH OUTLOOKS:
- 04/21 Market Recap: SPX will close below 04/20 close soon.
05/04 Market Outlook: At least a short-term top could have been in.- 05/05 Market Outlook: No –1,000 TICK on almost 1% down day, so 05/05 low will be taken soon.
HIGHLIGHTS OF THE OTHER ETFS IN MY PUBLIC CHART LIST:
|
|||||||||||||||||||||||||||||||||||||||||||||
|


