SHORT-TERM: IN WAIT AND SEE MODE
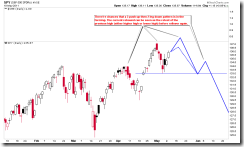
No conclusion today, need see the day after tomorrow. Yes, that’s the day after tomorrow, because tomorrow most likely will be up at least in the morning, while if indeed tomorrow is up then chances are high the day after tomorrow will be down. The question is down how much? So let’s wait for the day after tomorrow.
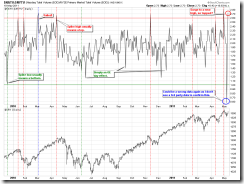
It’s still too early to declare bears dead because chart pattern wise, before decisively breakout 05/02 high, I still cannot exclude the possibilities that the current rebound is simply a retest of the previous high (before rollover again), especially when the 0.2.4 Nasdaq Total Volume/NYSE Total Volume yells for a top again today. Those who are frequent visitors to this blog should know that it’s a very reliable signal, so “to bear or to bull” still is hard to say.
Here’s the 0.2.4 Nasdaq Total Volume/NYSE Total Volume.
In addition, there’re two other signals I’d like your attention today:
OEX Open Interest Ratio new high again.
ISEE Equities Only Index closed at 271 which means that retailers are extremely bullish, while at the same time, OEX Put/Call Ratio shows that huge amount of OEX Put being opened today. I cannot say this is a very bearish sign but certainly it looks suspicious.
INTERMEDIATE-TERM: SPX NOW IN 1352 TO 1381 WAVE 5 PRICE TARGET AREA, WATCH FOR POTENTIAL REVERSAL
See 05/06 Market Outlook for more details.
SEASONALITY: BULLISH MONDAY
According to Stock Trader’s Almanac, Monday after Mother’s Day, Dow up 12 of last 15.
For May seasonality day by day please refer 04/29 Market Outlook.
ACTIVE BULLISH OUTLOOKS:
- 09/27 Market Recap: 9 POMO within 20 trading days means 14%+ up in 3 months.
- 03/11 Market Recap: Bullish in 3 to 6 months.
- 04/21 Market Recap: QQQ weekly Bullish Engulfing is bullish for the next 6 weeks.
ACTIVE BEARISH OUTLOOKS:
- 04/21 Market Recap: SPX will close below 04/20 close soon.
05/04 Market Outlook: At least a short-term top could have been in.- 05/05 Market Outlook: No –1,000 TICK on almost 1% down day, so 05/05 low will be taken soon.
- 05/06 Market Outlook: Bearish in 2 weeks.
HIGHLIGHTS OF THE OTHER ETFS IN MY PUBLIC CHART LIST:
|
|||||||||||||||||||||||||||||||||||||||||||||
|


