SHORT-TERM: PULLBACK NOT OVER YET
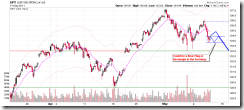
Big movement today (although I was too focused on moving my giant plant around to notice the show as some of you already knew), but too bad, I have not much to say. 1.0.0 S&P 500 SPDRs (SPY 60 min) doesn’t have lower low yet so strictly speaking the chart does not look bearish. However, considering the volume surge on 3.1.1 PowerShares DB US Dollar Index Bullish Fund (UUP Daily), so chances are high that the sell off on commodities is not over yet, therefore personally I’m more inclined to believe what I see is a Bear Flag or Rectangle, aka, more selling ahead.
Two things I’d like your attention today:
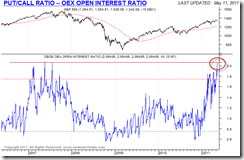
OEX Open Interest Ratio goes higher again. Almost near the all time high now. Looks more and more like that of year 2007, doesn’t it?
0.2.1 10Y T-Bill Yield on the other hand are yelling for bottom now. The signal (for bottom calling) is very reliable (top calling may be 1 month earlier), please refer to 8.2.1a Market top/bottom by ROC30 of 10Y T-Bill Yield 2001-2004 and 8.2.1b Market top/bottom by ROC30 of 10Y T-Bill Yield 2005-2008 for the past accuracy. How do I personally read this? Well, the standard answer is: let’s wait and see as for a no biased TA (at least pretend to be no biased), never ever should I say “this time is different” no matter I really want to believe it or not.
INTERMEDIATE-TERM: SPX NOW IN 1352 TO 1381 WAVE 5 PRICE TARGET AREA, WATCH FOR POTENTIAL REVERSAL
See 05/06 Market Outlook for more details.
SEASONALITY: BULLISH MONDAY
According to Stock Trader’s Almanac, Monday after Mother’s Day, Dow up 12 of last 15.
For May seasonality day by day please refer 04/29 Market Outlook.
ACTIVE BULLISH OUTLOOKS:
- 09/27 Market Recap: 9 POMO within 20 trading days means 14%+ up in 3 months.
- 03/11 Market Recap: Bullish in 3 to 6 months.
- 04/21 Market Recap: QQQ weekly Bullish Engulfing is bullish for the next 6 weeks.
ACTIVE BEARISH OUTLOOKS:
- 04/21 Market Recap: SPX will close below 04/20 close soon.
- 05/05 Market Outlook: No –1,000 TICK on almost 1% down day, so 05/05 low will be taken soon.
- 05/06 Market Outlook: Bearish in 2 weeks.
HIGHLIGHTS OF THE OTHER ETFS IN MY PUBLIC CHART LIST:
|
|||||||||||||||||||||||||||||||||||||||||||||
|


