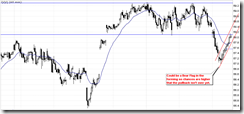
SHORT-TERM: A LITTLE LITTLE BEARISH BIASED
QQQ still clearly looks like a Bear Flag to me so I think the rebound today is just a rebound, the pullback isn’t over yet.
There’s another possibility, however, SPY daily chart looks still missing one more push up to form a so called 3 push up pattern, so it’s also possible that SPY would go directly from here to a new high. And therefore accordingly, trading wise, if another huge up day tomorrow, I’d be on the bull side.
The chart below illustrated the 3 push up followed by 2 legged down pattern. Now, it’s hard to judge whether the 2nd leg down is over but certainly we should be careful about the possible Bull Flag in the forming which if indeed, once the UUP pullback is over, it’d put pressure on the stock market again.
INTERMEDIATE-TERM: SPX NOW IN 1352 TO 1381 WAVE 5 PRICE TARGET AREA, WATCH FOR POTENTIAL REVERSAL
Maintain what I said in 05/06 Market Outlook. Need pay attention to the possibility that wave 5 ends while primary wave 3 sharply down has started. Still just an attention, not even a warning though.
SEASONALITY: BULLISH MONDAY, BEARISH FRIDAY
According to Stock Trader’s Almanac:
- Monday before May expiration, Dow up 19 of last 22, average gain 0.6%.
- May expiration day, Dow down 12 of last 20, average loss 0.2%.
For May seasonality day by day please refer 04/29 Market Outlook.
ACTIVE BULLISH OUTLOOKS:
- 09/27 Market Recap: 9 POMO within 20 trading days means 14%+ up in 3 months.
- 03/11 Market Recap: Bullish in 3 to 6 months.
- 04/21 Market Recap: QQQ weekly Bullish Engulfing is bullish for the next 6 weeks.
ACTIVE BEARISH OUTLOOKS:
- 04/21 Market Recap: SPX will close below 04/20 close soon.
05/05 Market Outlook: No –1,000 TICK on almost 1% down day, so 05/05 low will be taken soon.- 05/06 Market Outlook: Bearish in 2 weeks.
HIGHLIGHTS OF THE OTHER ETFS IN MY PUBLIC CHART LIST:
|
|||||||||||||||||||||||||||||||||||||||||||||
|


