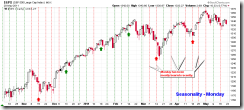
THE SHORT-TERM TREND IS DOWN, NOT CONFIRMED THOUGH, I HOLD BOTH LONG (TRAPPED) AND SHORT (TRAPPED) OVER THE WEEKEND
No idea about the next Monday. Seasonality is a little bearish biased but on SPY 60 min chart, the ChiOsc is low and a Head and Shoulders Bottom could be in the forming so really hard to call the next Monday. Guess we’ll have to wait and see AGAIN.
Enjoy your weekend!
MECHANICAL TRADING SIGNALS:
| TREND | MOMENTUM | COMMENT | |
| Long-term | 2 of 2 BUY | ||
| Intermediate | 5 of 5 SELL | 5 of 5 NEUTRAL | Cobra Impulse in SELL mode; Non-Stop in SELL mode. |
| Short-term | 6 of 6 NEUTRAL | ||
| SPY SYSTEM | ENTRY | STOP LOSS | INSTRUCTION: back test is HERE, signals are HERE. |
| Non-Stop | 05/10 S | N/A | Short is for aggressive traders only. |
| CI Buy & Hold | 05/17 S | N/A | |
| CI Swing | 05/17 S | 2*ATR (10) |
DEMO ACCOUNT FOR SHORT-TERM MODEL:
|
|||||||||||||||||||||||||||||||||||||||||||||||||||||||||||||||||||||||||||||||||||||||||||||||||||||||||||||||||||||||||||||||||||||||
|


