SHORT-TERM: COULD SEE REBOUND TOMORROW, BUT THE SELLING IS NOT OVER YET
As mentioned in today’s Trading Signals, statistically, the best cases there’re 76% chances a green day tomorrow. Find time to read it if you haven’t done so. I won’t bother to repeat the statistics here again. The chart below also argues at least a rebound tomorrow morning, but as per law of inertia, more likely the selling is not over yet, so trading wise, to sell bounce might not be a bad idea.
There’re three additional things I’d like you attention today:
- 0.0.2 Combined Intermediate-term Trading Signals, 3 point validated trend line broken today. As long as the line could hold for tomorrow then a top of some kind should be confirmed. Frequent readers to this blog should know it’s a very reliable top signal. Well, I guess, after today’s sharp sell off, maybe too later to say this now.
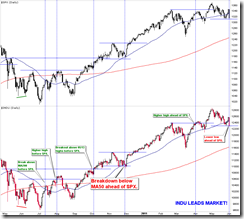
- 1.2.0 INDU Leads Market, INDU lower low ahead of SPX could mean that SPX will follow soon. Generally when the stock market is in a downtrend, the big caps should hold relatively well, because they’re the safest. If, however, big caps are leading down, then it could mean institutions are selling which obviously is not a good sign.
- A little attention for Sentimentrader subscribers, the OEX Open Interest Ratio reading from Sentimentrader is wrong today. The chart below shows the official CBOE readings. If any of you have time, please notify Jason as I think this is a critical data. Besides, Sentimentrader nowadays is often wrong about the Rydex readings – put bearish reading into bullish signals or put bullish reading into bearish signals, please anyone have time, tell Jason too.
INTERMEDIATE-TERM: MAY SEE NEW HIGH, TARGETING SPX 1352 to 1381 AREA, BIG CORRECTION MAY FOLLOW AFTER THAT
See 05/27 Market Outlook for more details.
SEASONALITY: BULLISH TUESDAY, WEDNESDAY AND THE ENTIRE WEEK
See 05/27 Market Outlook for more details.
The following seasonality chart is from Bespoke.
The following seasonality chart is from Sentimentrader.
ACTIVE BULLISH SIGNALS:
- 0.2.1 10Y T-Bill Yield: ROC(30) < –9, so bottomed?
ACTIVE BEARISH SIGNALS:
- 4.0.7a Collection of Leading Indicators I: Negative divergences become too much and too big.
- 8.1.1 Normalized NATV/NYTV: Too high, so topped?
0.2.4 Nasdaq Total Volume/NYSE Total Volume: New recovery high, so topped?
ACTIVE BULLISH OUTLOOKS:
- 09/27 Market Recap: 9 POMO within 20 trading days means 14%+ up in 3 months.
- 03/11 Market Recap: Bullish in 3 to 6 months.
- 04/21 Market Recap: QQQ weekly Bullish Engulfing is bullish for the next 6 weeks.
- 05/27 Market Outlook: II Correction % too high, so should be a new high ahead then followed by a real correction.
ACTIVE BEARISH OUTLOOKS:
05/27 Market Outlook: May revisit 05/25 lows the next week, at least a dip of some kind.
HIGHLIGHTS OF THE OTHER ETFS IN MY PUBLIC CHART LIST:
|
||||||||||||||||||||||||||||||||||||||||||||||||
|


