SHORT-TERM: EXPECT REBOUND AS EARLY AS THE NEXT MONDAY
Three cents:
- Expect rebound as early as the next Monday.
- STATISTICALLY the odds for a green next week WAS only 25%. Also the next next and the next next next week won’t be pleasant as well. I’ll present my witness in the intermediate-term session below.
- Trading wise, the game to me is to sell bounce.
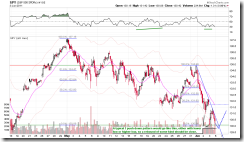
The chart below illustrated the usual bottoming pattern. There’re good chances the sell off before the Friday close was simply the retest of the previous low, or a little lower odds – lower low the next Monday morning before the rebound begins.
0.1.0 SPY Short-term Trading Signals, hollow red bar could mean a reversal.
0.2.0 Volatility Index (Daily), VIX may pullback. Especially, VIX had no higher high on Friday which if still VIX leads, then it should mean that SPY was bottomed.
The statistics below should be clear that even down Monday again, whatever losses shall be recovered soon.
The last but not the least, CPC is way too high, so either green Monday or at least no more lower low.
INTERMEDIATE-TERM: STATISTICALLY BEARISH FOR THE NEXT 3 WEEKS
See charts below, should be clear enough. IWM weekly Bearish Engulfing and SPY down 5 consecutive weeks, both argue for a not so bull friendly next 3 weeks. Especially the statistics for “short until IWM down 2 consecutive weeks”, it HAD astonishingly 100% winning rate.
SEASONALITY: NO UPDATE
See 06/01 Market Outlook for June day to day seasonality.
ACTIVE BULLISH SIGNALS:
- 0.2.1 10Y T-Bill Yield: ROC(30) < –9, so bottomed?
ACTIVE BEARISH SIGNALS:
4.0.7a Collection of Leading Indicators I: Negative divergences become too much and too big.8.1.1 Normalized NATV/NYTV: Too high, so topped?
ACTIVE BULLISH OUTLOOKS:
- 09/27 Market Recap: 9 POMO within 20 trading days means 14%+ up in 3 months.
04/21 Market Recap: QQQ weeklyBullish Engulfingis bullish for the next 6 weeks.Failed!05/27 Market Outlook:IICorrection % too high, so should be a new high ahead then followed by a real correction.Failed!
ACTIVE BEARISH OUTLOOKS:
- 06/03 Market Outlook: IWM weekly Bearish Engulfing and SPY down 5 consecutive weeks were bearish for the next 3 weeks.
HIGHLIGHTS OF THE OTHER ETFS IN MY PUBLIC CHART LIST:
|
||||||||||||||||||||||||||||||||||||||||||||||||
|


