SHORT-TERM: NOT SURE ABOUT REBOUND BUT AT LEAST TODAY’S LOW WILL BE REVISITED
From the statistics mentioned in today’s Trading Signals, a rebound of some kind seems imminent. But by read carefully the chart of all the past cases, my conclusion is, such a rebound most likely is another chance to sell. The theory behind is simple, down 5 consecutive days or closed below BB bottom for 3 days in a row is a sign of strong down momentum, so the very first rebound usually should fail.
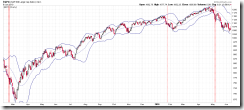
The chart below are all the past cases since year 2000 when SPX closed below BB bottom for 3 or more consecutive days where multiple consecutive dashed lines means more than 3 days closed below BB bottom. With no exception, either a small rebound tomorrow then down again to at least test today’s low, or the worse, simply closes below BB bottom for a few more days.
The chart below shows all the past cases since year 2000 when SPX down 5 or more consecutive days. Granted, some of the cases are very bullish for the short-term if huge rebound tomorrow, but still with no exception that eventually today’s low would be revisited.
So again, the conclusion is at least bears have one more chance to sell the bounce even if the low was in today.
INTERMEDIATE-TERM: STATISTICALLY BEARISH FOR THE NEXT 3 WEEKS
See 06/03 Market Outlook for more details.
SEASONALITY: NO UPDATE
See 06/01 Market Outlook for June day to day seasonality.
ACTIVE BULLISH SIGNALS:
- 0.2.1 10Y T-Bill Yield: ROC(30) < –9, so bottomed?
ACTIVE BEARISH SIGNALS:
- N/A
ACTIVE BULLISH OUTLOOKS:
- 09/27 Market Recap: 9 POMO within 20 trading days means 14%+ up in 3 months.
ACTIVE BEARISH OUTLOOKS:
- 06/03 Market Outlook: IWM weekly Bearish Engulfing and SPY down 5 consecutive weeks were bearish for the next 3 weeks.
HIGHLIGHTS OF THE OTHER ETFS IN MY PUBLIC CHART LIST:
|
||||||||||||||||||||||||||||||||||||||||||||||||
|


