SHORT-TERM: THE REST OF THE WEEK MIGHT NOT BE PLEASANT
Whether the low was in, I’ll have to wait and see. For now, I still think this is just a rebound therefore a sell opportunity. Two reasons:
- The statistics mentioned in 06/03 Market Outlook, weekly IWM Bearish Engulfing and SPX down 5 consecutive weeks means unpleasant the next week.
- According to Stock Trader’s Almanac, week after June Triple Witching, Dow down 11 in a row and 18 of last 20, average loss since 1990, 1.2%.
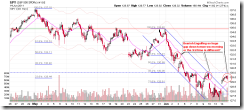
About tomorrow morning, the chart below is very interesting. Looks like the Bearish Engulfing formed in the last couple of hours means a huge gap down tomorrow. The bull’s question though: Will the 3rd time be the charm?
For the rest 3 days of this week, so far the evidences I’ve collected are arguing for up one more day AT MOST, either tomorrow or the day after tomorrow.
Why up either tomorrow or the day after tomorrow, but not both? Two reasons:
- NYADV too high, see chart below, more likely down tomorrow, or small green the most and if up tomorrow, then the day after tomorrow would be down.
- ISEE Indices & ETFs Only Index < ISEE Equities Only Index AND ISEE Indices & ETFs Only Index >= 100, sell short at today’s close, hold until the very first down day, since year 2006 the inception of the ISEE Indices & ETFs Only Index, you have 74% chances. Noticed that on average winners took 1.8 trading days, so it’s logic to say down day the day after tomorrow at the latest.
Then why down Friday? This is according to Stock Trader’s Almanac, June Triple Witching Day, Dow down 7 of last 12, average loss 0.5%. Besides, from the chart below, looks like all the recent Fridays were not very bull friendly.
INTERMEDIATE-TERM: STATISTICALLY BEARISH FOR THE NEXT 2 WEEKS
See 06/03 Market Outlook for more details.
SEASONALITY: BEARISH MONDAY AND FRIDAY
According to Stock Trader’s Almanac:
- Monday of Triple Witching Week, Down down 8 of last 13.
- June Triple Witching Day, Dow down 7 of last 12, average loss 0.5%.
Also see 06/01 Market Outlook for June day to day seasonality.
ACTIVE BULLISH SIGNALS:
- 8.1.5 Normalized CPCE: Too high, so bottomed?
ACTIVE BEARISH SIGNALS:
- N/A
ACTIVE BULLISH OUTLOOKS:
- 09/27 Market Recap: 9 POMO within 20 trading days means 14%+ up in 3 months.
- 06/10 Market Outlook: 75% to 81% chances a green next week.
ACTIVE BEARISH OUTLOOKS:
- 06/03 Market Outlook: IWM weekly Bearish Engulfing and SPY down 5 consecutive weeks were bearish for the next 3 weeks.
06/08 Market Outlook: The very first rebound most likely will fail.06/10 Market Outlook: 83% chances a lower low the next week.
HIGHLIGHTS OF THE OTHER ETFS IN MY PUBLIC CHART LIST:
|
||||||||||||||||||||||||||||||||||||||||||||||||
|


