SHORT-TERM: IN WAIT AND SEE MODE
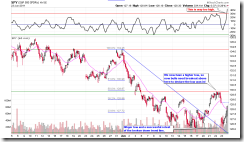
Nothing new, all I wanted to say were already in today’s Trading Signals. The chart pattern is a typical Trading Reversal setup: Breakout downtrend line then pullback to test the previous low then sharp rebound. All bulls need the next are to breakout yesterday high forming a higher high (aka 1-2-3 formation) to confirm the low was in. So, all in all, bulls got the ball, but need the final score to win the game.
The bear’s only hope, also mentioned in today’s Trading Signals: ChiOsc is way too high. The chart below shows the recent 2 years when SPY 60 min ChiOsc was very high. Clearly we can see, far more down (red lines) or consolidation (blue lines) cases thereafter than simply up and up from here (green line). So officially, bull or bear, we still have to see tomorrow, although the feeling now seems the game was over for bears.
INTERMEDIATE-TERM: STATISTICALLY BEARISH FOR THE NEXT WEEK
See 06/03 Market Outlook for more details.
SEASONALITY: BEARISH NEXT WEEK
According to Stock Trader’s Almanac, week after June Triple Witching, Dow down 11 in a row and 18 of last 20, average loss since 1990, 1.2%.
Also see 06/01 Market Outlook for June day to day seasonality.
ACTIVE BULLISH SIGNALS:
8.1.5 Normalized CPCE: Too high, so bottomed?06/17 Market Outlook: Net % of allSentimentrader’s Indicators at Extreme is very bullish.
ACTIVE BEARISH SIGNALS:
- N/A
ACTIVE BULLISH OUTLOOKS:
- 09/27 Market Recap: 9 POMO within 20 trading days means 14%+ up in 3 months.
06/10 Market Outlook: 75% to 81% chances a green next week.
ACTIVE BEARISH OUTLOOKS:
- 06/03 Market Outlook: IWM weekly Bearish Engulfing and SPY down 5 consecutive weeks were bearish for the next 3 weeks.
HIGHLIGHTS OF THE OTHER ETFS IN MY PUBLIC CHART LIST:
|
||||||||||||||||||||||||||||||||||||||||||||||||
|


