SHORT-TERM: COULD SEE PULLBACK AS EARLY AS THE NEXT TUESDAY
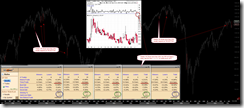
First of all, for fun only, here’s a bearish biased evil plan. My guess is we’ll repeat year 2007. Since this week’s push up was very strong, so chances are high that we’ll see a new high, therefore the bears’ best hope is the 3 push up pattern. Again, let me make this very clear, I don’t care bear or bull, but even bull plan still has to eliminate the possible bear plan first. So all I need is just to make a bearish plan (worst case). Also the chart below is for direction only, price and time are not part of my plan.
OK, now we know the plan, so it should be easy to understand what I’m about to blah blah the next.
Four cents:
- The Friday’s high is not the high. Should be more higher high ahead.
- Market is a little overbought, so a pullback is just a matter of time which will unlikely be small.
- Bullish July. (See Intermediate-term Session below)
- Trading wise, pullback, if any, is buy.
Why isn’t the Friday’s high the high?
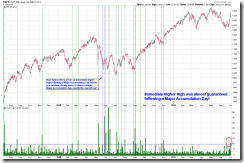
- Because Friday is a Major Accumulation Day (NYSE Up Volume : NYSE Down Volume >= 9). Never was a Major Accumulation Day exactly the market top.
- As mentioned in Friday’s Trading Signals, although extremely high NYADV MA(5) should mean a red Tuesday but it also means a very strong up momentum which almost guarantees a higher high ahead.
Why won’t the pullback size be small?
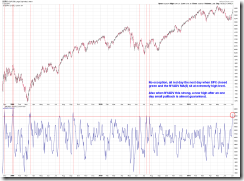
- Because NYMO is way too high.
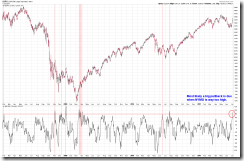
- Another reason is RSI on SPX 60 min chart which sits at historical high. Although in total from the chart below, a very high RSI only had 50% chances for a big pullback, but since all the big pullbacks happened recently (which should weight more), plus the NYMO too high mentioned above, so I think it’s logical to consider this as another reason to expect a big pullback.
As for overbought, listed below are some of the most reliable indicators.
- T2122, this is my ultimate weapon for watching overbought/oversold. I’ve explained before, although not historically extreme, but since the general market indexes are very high now so the current reading should be extreme enough as it becomes more and more difficult for an already high stock to go higher.
- T2103, this basically is NYADV, just it’s more eye catching than NYADV, LOL.
- NYADV.
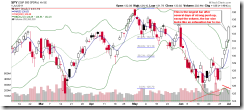
- Friday’s bar looks very much like an exhaustion bar.
- SPX 110% above BB top since year 2003.
- The last but not the least, don’t forget the TICK, the NYADV MA(5) and the Price Volume Negative Divergence mentioned in the Friday’s Trading Signals. They’re all not so bull friendly.
INTERMEDIATE-TERM: BULLISH JULY
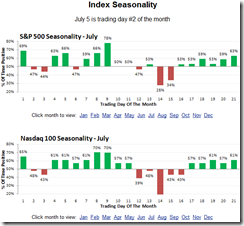
Statistics plus bullish July seasonality, looks like we’re going to have a bullish July.
- VIX weekly dropped more than 24%, from the chart below (highlighted in red) we can see such a case usually means an important bottom.
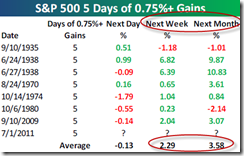
- The statistics below are from Bespoke, both argue for a bullish July. Between them, the A/D Line thrust from oversold to overbought within a short period of time is a very reliable bullish signal.
SEASONALITY: BULLISH JULY
The following July seasonality chart is from Bespoke.
The following day by day July seasonality chart is from Sentimentrader.
ACTIVE BULLISH OUTLOOKS:
- 09/27 Market Recap: 9 POMO within 20 trading days means 14%+ up in 3 months.
- 07/01 Market Outlook: Bullish July.
ACTIVE BEARISH OUTLOOKS:
- 07/01 Market Outlook: Market is a little overbought, could see pullback soon.
SUMMARY OF SIGNALS FOR MY PUBLIC CHART LIST:
|
|||||||||||||||||||||||||||||||||||||||||||||
|
|||||||||||||||||||||||||||||||||||||||||||||
|


