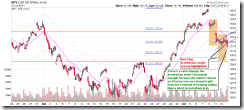
SHORT-TERM: REBOUND MAY OR MAY NOT TOMORROW BUT MORE LIKELY LOWER CLOSE AHEAD EVENTUALLY
I said yesterday, the selling didn’t appear over because the Bear Flag was missing. Well, today we got the Flag and it did breakdown, but unfortunately, the breakdown didn’t get enough time before the market closed, so it’s not clear yet whether the breakdown is decisive enough, therefore cannot exclude the possibility that the low was in or very close (as the mini 2 legged down has been fulfilled). So sorry guys, we’ll have to wait until tomorrow.
However, there’s one thing I’m a little certain: If indeed the market rebounds right away tomorrow, the rebound most likely is sell. The argument is a strong uptrend should never have 3 consecutive down days. The chart below should be clear enough, at least lower close ahead.
INTERMEDIATE-TERM: BULLISH JULY
See 07/01 Market Outlook and 07/05 Market Outlook for more details.
SEASONALITY: BULLISH MONDAY BEARISH FRIDAY, BEARISH JULY EXPIRATION WEEK
According to Stock Trader’s Almanac:
- Monday before July expiration, Dow up 6 of last 7.
- July expiration day, Dow down 6 of last 10, off 390 points (4.6%) in 2002.
Also see 07/01 Market Outlook for July seasonality chart
ACTIVE BULLISH OUTLOOKS:
- 09/27 Market Recap: 9 POMO within 20 trading days means 14%+ up in 3 months.
- 07/01 Market Outlook: Bullish July. Also one more evidence in 07/05 Market Outlook.
- 07/07 Market Outlook: New NYHGH high means SPX higher high ahead.
ACTIVE BEARISH OUTLOOKS:
07/01 Market Outlook: Market is a little overbought, could see pullback soon.07/08 Market Outlook: Could see some weakness the next week.
SUMMARY OF SIGNALS FOR MY PUBLIC CHART LIST:
|
|||||||||||||||||||||||||||||||||||||||||||||
|
|||||||||||||||||||||||||||||||||||||||||||||
|


