SHORT-TERM: COULD SEE MORE SELLING AHEAD
Two cents:
- Chances are high that the low wasn’t in yet.
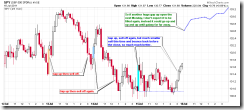
- Although the week had 3 huge gap up in a row so needs some kind of miracles for another huge gap up the next Monday. But if indeed, then I’d say goodbye to bears, at least for short-term. Yes, I believe the low wasn’t in but I also believe to trade what I see not what I believe, and so far as you know, to be a bull in this market requires no reason but imagination, so if indeed that miracle happens again the next Monday, no argue, period. The chart below explains why I think if another huge gap up the next Monday, it’ll go galaxy far far away. Because for the week’s 3 huge gap up, 2 were sold off hard, but the last one, got filled again, true, but came back right before the close, so it’s much better, therefore logically, if the 4th huge gap up, it should do much much better, agree?
OK, now let’s talk what I believe: Why wasn’t the low in?
- In 07/14 Market Outlook, I mentioned Non-Stop model sell signal. I believe most of you didn’t pay enough attention because it’s simply a trend following system, so the winning rate cannot be good. However, see the back test below (Since the inception of the CPCE in year 2004), the sell signal was correct 92% of the time. Please be noted, a correct entry doesn’t mean a winning trade as long as you don’t have a correct exit, so I don’t mean to follow the Non-Stop to short, you’d have 92% winning rate. What I want to prove here is the sell signal could mean more selling ahead, range from 3 to 20 calendar days on average until the lowest close.
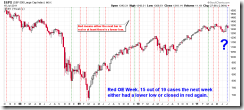
- In Friday’s Trading Signals, I mentioned, except the bearish seasonality for the next week, statistically a red option expiration week means 79% chances either a lower low or red the next week.
- Despite the Friday’s roaring high at close, the chart pattern still mostly looks like Rectangle which means higher chances of continuing lower.
INTERMEDIATE-TERM: BULLISH JULY
See 07/01 Market Outlook and 07/05 Market Outlook for more details.
SEASONALITY: BEARISH NEXT WEEK
According to Stock Trader’s Almanac, week after July expiration, Dow down 7 of last 12, 2007 –4.2%, 2008 –4.3%, but up 4.0% in 2009.
Also see 07/01 Market Outlook for July seasonality chart
ACTIVE BULLISH OUTLOOKS:
- 09/27 Market Recap: 9 POMO within 20 trading days means 14%+ up in 3 months.
- 07/01 Market Outlook: Bullish July. Also one more evidence in 07/05 Market Outlook.
- 07/07 Market Outlook: New NYHGH high means SPX higher high ahead.
ACTIVE BEARISH OUTLOOKS:
- N/A
SUMMARY OF SIGNALS FOR MY PUBLIC CHART LIST:
|
|||||||||||||||||||||||||||||||||||||||||||||
|
|||||||||||||||||||||||||||||||||||||||||||||
|


