SHORT-TERM: A TRADABLE BOTTOM COULD BE IN
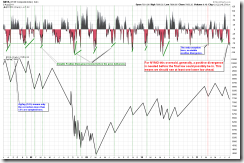
The chart below is my wild-est-est-est-est-est guess for the future, based on all the evidences so far I’ve collected. I know someone would argue that this Head and Shoulders Top is too obvious to be functional. Well, no comments, let’s wait and see. Statistically, Head and Shoulders Top has 55% chances to meet its text book target. And ever since the March 2009, we’ve had 2 failed Head and Shoulders Top already, so the question is: will the 3rd time be the charm? Don’t forget, it has 55% chances statistically, failed 3 times then the failure rate would be near 100% instead of 45%, we should then forget about this so called Head and Shoulders Top then. (I know failed 3 of 3 doesn’t mean failure rate is 100%, I should count 100 or more cases, blah blah, well, let’s wait and see, OK? LOL)
OK, you see my crystal ball, now it’s time for me to explain why such a wild-est-est-est-est-est guess. However, if your goal here is to know the conclusion then you should pretty much stop here, no need to read below although my Chinese English is really beautiful.
Why was a tradable bottom in?
Four reasons:
- Hammer, largest Volume recently and successful testing of the March lows, the SPX daily bar today looks a lot like a bottom.
- 0.3.1 Extreme Put Call Ratio Watch, CPC, CPCE, CPCI are all very high now therefore are arguing for a bottom.
- 0.2.1 10Y T-Bill Yield, ROC(30) < –9, so the bottom might be in. The signal was wrong recently but if you take a look at its past performance from 8.2.1a Market top/bottom by ROC30 of 10Y T-Bill Yield 2001-2004 to 8.2.1b Market top/bottom by ROC30 of 10Y T-Bill Yield 2005-2008, you’d believe it’s pretty reliable.
- VIX leads.
Why is the rebound target above MA(200), and could rise to August 9?
- FOMC is on August 9. Usually market is likely up until then.
- The statistics below should mean MA(200) won’t be simply broken without a fight. I expect some seasaws over it, which means we’ll see SPX break above it at least once.
The last but not the least, why will the rebound fail eventually?
I’ve provided enough evidences in 08/01 Market Outlook and 08/02 Market Outlook, among them, two of the most important are listed below:
- SPX down 5 or more days means rebound then at least revisits the previous low, more likely lower low. The charts are too many to list below so if you’re interested, please go to my public chart list, read from 8.2.4a SPX Consecutive 5 or More Down Days 2000 – 2001 to 8.2.4e SPX Consecutive 5 or More Down Days 2010 – 2011.
- NYMO visible positive divergence still missing. What is visible positive divergence? Those divergence can only be seen via magnifier doesn’t count. So the question is, are you able to see divergence below with your naked eyes? Me, as Cobra, a snake with glasses cannot even see it, I don’t believe you can.
INTERMEDIATE-TERM: IN DOWNTREND, COULD BE A HEAD AND SHOULDERS TOP FORMED, TARGETING SEP 2010 LOWS
See short-term session above for the chart, in wait and see mode as the Head and Shoulders Top breakdown not confirmed yet.
SEASONALITY: BEARISH FIRST 9 TRADING DAYS OF AUGUST
See 07/29 Market Outlook for more details. Also please see 07/29 Market Outlook for day to day August seasonality chart.
ACTIVE BULLISH OUTLOOKS:
- 08/03 Market Outlook: A tradable bottom might be in, targeting MA(200) above.
ACTIVE BEARISH OUTLOOKS:
- 08/01 Market Outlook: Rebound, if any, is sell. Also so 08/02 Market Outlook for more evidences.
SUMMARY OF SIGNALS FOR MY PUBLIC CHART LIST:
|
|||||||||||||||||||||||||||||||||||||||||||||
|
|||||||||||||||||||||||||||||||||||||||||||||
|


