SHORT-TERM: EXPECT REBOUND SOON, BUT REBOUND, IF ANY, IS SELL
Still the old cliche, rebound, may be, but such a rebound most likely is a sell opportunity.
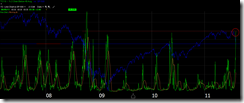
I’ve mentioned lots of evidences in 08/04 Market Outlook arguing for a rebound. They become even more extreme after the Friday session, so will maintain the conclusion that a sizeable rebound could be within 3 trading days (starting from 08/05). Listed below are all the extremes I mentioned recently. Among them, the T2122 is newly added which I hope you still remember is my ultimate weapon for watching oversold and overbought. It’s not there yet, but close, worth paying attention now.
I’ve been blah blah in almost all my recent Market Outlook about the law of inertia, arguing such a strong push down, usually the very first rebound would fail. My main argument so far is NYMO missing positive divergence. Today, I’d like you to meet my 3 other witnesses:
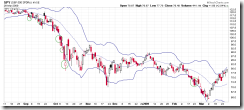
- Take a look at the bottom patterns when correction was larger than 14% (which means the push down was very strong). Personally, I even think we’re now still on the very 1st leg down.
- By Friday close, VIX rose 30% within 2 days. Listed below are all the cases since year 2000. Clearly we can see, it’s rare the Friday’s low is the low. See my public chart list for more histories, starting form 8.3.4a VIX Rose 35% in 2 Days – 1990.
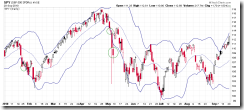
- By Friday close, we had another day that SPY daily body is completely below its BB bottom. Listed below are all the cases since year 2000. Also arguing that it’s rare the Friday’s low is exactly the low, at least it’ll be revisited later assuming huge rebound starting from the next Monday. Also you can check my public chart list for more histories, starting from 8.3.6a SPY Daily Bar Completely Below BB Bottom – 1993.
INTERMEDIATE-TERM: CONCEPT ONLY, THE WORSE CASE SPX DOWNSIDE TARGET IS 1,000
I have no solid evidences to talk you into believing some scary intermediate-term target. The chart below is concept only. Generally, most big pullbacks in a bull market ended at BB mid line. We’re now at such a general target and if the market cannot hold here, then the next target would be the BB bottom which is around SPX 1,000.
SEASONALITY: BEARISH FIRST 9 TRADING DAYS OF AUGUST
See 07/29 Market Outlook for more details. Also please see 07/29 Market Outlook for day to day August seasonality chart.
ACTIVE BULLISH OUTLOOKS:
08/03 Market Outlook: A tradable bottom might be in, targetingMA(200) above.Failed!- 08/04 Market Outlook: Relief rally could be within 3 trading days.
ACTIVE BEARISH OUTLOOKS:
- 08/01 Market Outlook, 08/02 Market Outlook, 08/05 Market Outlook: Rebound, if any, is sell.
SUMMARY OF SIGNALS FOR MY PUBLIC CHART LIST:
|
|||||||||||||||||||||||||||||||||||||||||||||
|
|||||||||||||||||||||||||||||||||||||||||||||
|


