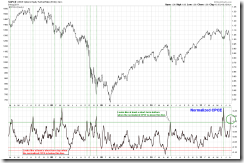
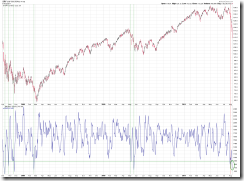
SHORT-TERM: EXPECT REBOUND SOON, BUT REBOUND, IF ANY, IS SELL
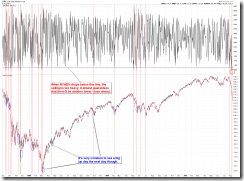
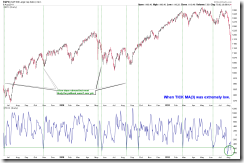
Nothing new today, still the cliche, a rebound is due but since the selling is too strong, so most likely the very first rebound would fail. Both charts below support such a cliche: Although we could see a rebound but chances are the selling isn’t over yet.
Nothing else to say, all the signals I watch daily are oversold now except T2122 which is still a little shy of extremes, which, some of you already knew, is my ultimate weapon for watching oversold/overbought, so maybe the market will drop again tomorrow. The problem now is it’s very hard to know exactly when the rebound will be, so trading wise, as you all know, personally I never front-run the market (and you should now know why. It’s true, the current case is very very rate, but as long as we stay in the market for many many years, there’re good chances we’d run into days like nowadays and if your trading strategy cannot handle this kind of situation you might end up losing everything. So basically a trading strategy should be 100% reliable, not 90%), but if you’ve already bought the dip, I don’t think average down is a good idea. As for shorting, I think now is equally dangerous too, so maybe day trade or sideline is the best way to go.
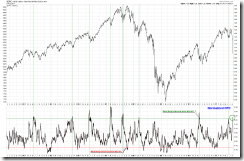
Simply listed below are all the oversold signals I watch everyday, all are no ordinary signals, so should be very reliable. That said, under the current condition, you don’t need to see any signals before knowing the market is way oversold, so really, it doesn’t matter if you see them or not. But if they could make you feel a little bit better for your underwater position, then I’m glad of being a little help here.
INTERMEDIATE-TERM: CONCEPT ONLY, THE WORSE CASE SPX DOWNSIDE TARGET IS 1,000
See 08/05 Market Outlook for more details.
SEASONALITY: BEARISH FIRST 9 TRADING DAYS OF AUGUST
See 07/29 Market Outlook for more details. Also please see 07/29 Market Outlook for day to day August seasonality chart.
ACTIVE BULLISH OUTLOOKS:
08/03 Market Outlook: A tradable bottom might be in, targetingMA(200) above.Failed!- 08/04 Market Outlook: Relief rally could be within 3 trading days.
ACTIVE BEARISH OUTLOOKS:
- 08/01 Market Outlook, 08/02 Market Outlook, 08/05 Market Outlook: Rebound, if any, is sell.
SUMMARY OF SIGNALS FOR MY PUBLIC CHART LIST:
|
|||||||||||||||||||||||||||||||||||||||||||||
|
|||||||||||||||||||||||||||||||||||||||||||||
|

