SHORT-TERM: MORE DOWN AHEAD
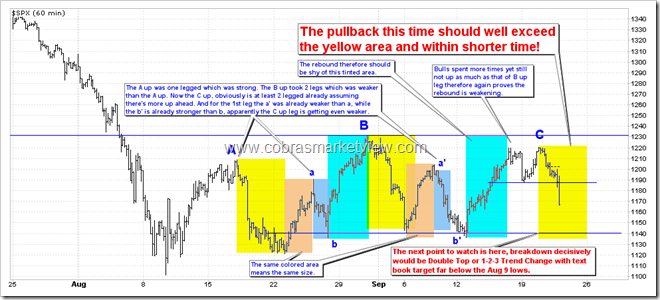
The drop today once again proves that the rally since Aug 9 was (is) just a rebound. Let’s review my evil plan again:
- Rally a > Rally a’
- Pullback b < Pullback b’
- The time spent on rally B < The time spent on rally C
- The drop today basically proves, indeed as I speculated, the rally B > Rally C
The price movement is basically one side (say, bear) grows stronger as the other side (say, bull) becomes weaker and vice versa. Since according to the list above, obviously the rebound becomes weaker and weaker and the pullback gets stronger and stronger therefore I expect the pullback this round to exceed the yellow tinted area and within even shorter time than the pullback marked by the yellow area in the middle. Actually, if you watch the chart carefully, you should’ve already noticed that, from left to right, the 3 yellow tinted area, the pullback marked by the yellow area in the middle was already larger and within shorter time than that of the pullback market by the 1st yellow area. By the way, if eventually, the pullback this time is less than the yellow area or uses more time than the previous one, then what does that mean? Well, based on the same “one side grows stronger as the other side becomes weaker” theory, that should imply bulls are growing stronger therefore a much larger rebound is due, right?
OK, the above conclusion was based purely on the chart patter, we still need the 3rd party evidences, right? Well, here we go. Why is more down ahead?
- Since the year 2009 bull market, whenever SPX had 3 consecutive down days, most likely there was a lower close ahead, with very few exceptions.
- Today is a Major Distribution Day, which means the down momentum is strong, so according to the law of inertia, it almost guarantees a lower low ahead. Again, pay attention here, I said lower low ahead, not lower close ahead.
- As mentioned in today’s Trading Signals, more likely 2 consecutive down days after a Red FOMC day.
- As per all the evidences above, the Double Top text book target as illustrated in the chart below has very high chances to be realized. Actually, according to Bulkowski, who should be the authority on chart pattern research, Double Top itself has 73% chances to fulfill its text book target.
INTERMEDIATE-TERM: SPX DOWNSIDE TARGET IS 1,000, THE CORRECTION COULD LAST 1 TO 2 MONTHS
See 08/19 Market Outlook for details.
SEASONALITY: BEARISH WEEK
According Stock Trader’s Almanac, week after September Triple Witching, Dow down 16 of last 20, average loss since 1990, 1.1%.
See 09/02 Market Outlook for September seasonality.
SUMMARY OF SIGNALS FOR MY PUBLIC CHART LIST:
|
||||||||||||||||||||||||||||||
|
||||||||||||||||||||||||||||||
|


