SHORT-TERM: COULD SEE REBOUND AS EARLY AS TOMORROW BUT THE LOW WASN’T IN YET
Two cents:
- The low wasn’t in yet.
- Could see huge rebound as early as tomorrow. Pay attention to “as early as”, as I’m not sure exactly when.
So the conclusion is, if indeed a huge rebound starting from tomorrow, it should be a sell opportunity.
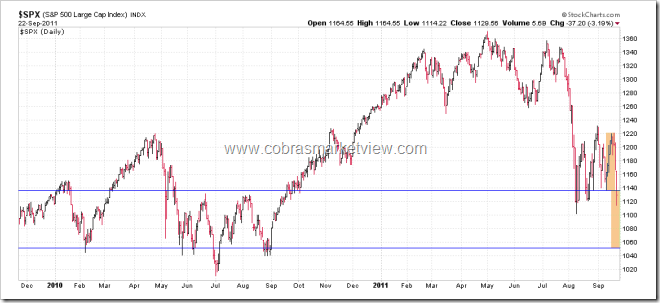
Let’s follow up yesterday’s Market Outlook first. Exactly as I said yesterday, the pullback well exceeded the yellow area and within much shorter time than the 2 previous pullbacks marked by yellow area. This again proves the selling is strengthening, so according to the “one side grows stronger as the other side becomes weaker” theory, most likely today’s low is not the low because at least bulls need one stronger swing to prove that the rebound has further to go.
So, what’s the target for the current pullback then? Still the chart above, I forgot to mention specifically in text yesterday, but the annotation is clear on the chart. It says, pay attention to the breakdown as it could then be a Double Top or 1-2-3 Trend Change. Well, we had the breakdown today indeed, so the next target could be calculated via the Double Top text book target, see tinted area below. Such a target, according to the statistics provided by Bulkowski, has 73% chances to be met.
OK, so much for the chart analysis, now it’s the time for the 3rd party evidences. Why wasn’t the low in yet? Also, because most evidences I have today are arguing for a rebound then more down ahead, so I won’t give another list to prove why we could see a huge rebound as early as tomorrow. Instead I’ll (and have to) mix all the evidences together.
- Today is another Major Distribution Day, so still the down momentum is strong therefore more likely a lower low ahead.
- 2 Major Distribution Day within 5 days may mean a short-term rebound but more selling ahead anyway with or without the rebound first.
- Extremely low TICK MA(3) also argues for a short-term rebound, but such a low TICK also imply a strong down momentum therefore after the rebound, more selling ahead.
- SPY daily bar opened and closed below its BB bottom, again argues for a strong down momentum therefore the very first rebound is likely to fail. For all the past patterns please refer form chart 8.3.6a SPY Daily Bar Completely Below BB Bottom – 1993 to 8.3.6j SPY Daily Bar Completely Below BB Bottom – 2011, I see no exceptions, even a huge rebound does start from tomorrow, at least today’s low will be revisited eventually.
- The chart below argues for at least a short-term rebound, as NYLOW is way too high.
There’re 3 additional charts I’d like your attention:
- Non-Stop sell signal was triggered today, so should close long and open short tomorrow. The sell signal is a little unique today because it’s trigged by BPSPX and BPNDX, unlike most the other times the signals are given by RSP:CPCE (so called primary sell signal). From the past history (8.2.2a Non-Stop Model – 2004 to 8.2.2h Non-Stop Model – 2011), I see only 3 similar cases, 03/06/2008, 11/12/2008 and 06/29/2010, the market all dropped further thereafter. So at least I can say that today’s special sell signal worked for the past 3 times.
- I see Hindenburg Omen triggered today. The last time this omen triggered, it’s all over the media, so, as per most people like to say, too much attention to work. This time, however, until now, I don’t see anyone mentioning it, so may or may still not work. Anyway, for a confirmed Hindenburg Omen, a second such a signal is needed, so it’s just a warning now to make sure you guys know, hey, I’m the first one noticed this.
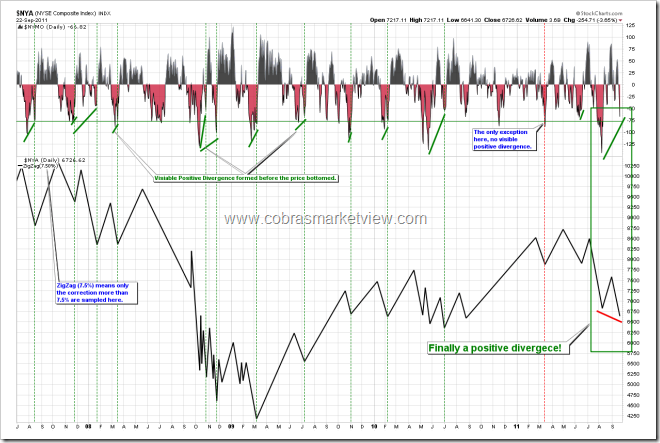
- I bet someone would remind me that we finally have the visible positive divergence on NYMO. Yes, I’ve noticed that, so firstly, it again proves such a positive divergence is needed (therefore I’m right again) and secondly, it just mean that now the market has the qualification to be bottomed but it doesn’t prove that indeed it was bottomed.
INTERMEDIATE-TERM: SPX DOWNSIDE TARGET IS 1,000, THE CORRECTION COULD LAST 1 TO 2 MONTHS
See 08/19 Market Outlook for details.
SEASONALITY: BEARISH WEEK
According Stock Trader’s Almanac, week after September Triple Witching, Dow down 16 of last 20, average loss since 1990, 1.1%.
See 09/02 Market Outlook for September seasonality.
SUMMARY OF SIGNALS FOR MY PUBLIC CHART LIST:
|
||||||||||||||||||||||||||||||
|
||||||||||||||||||||||||||||||
|


