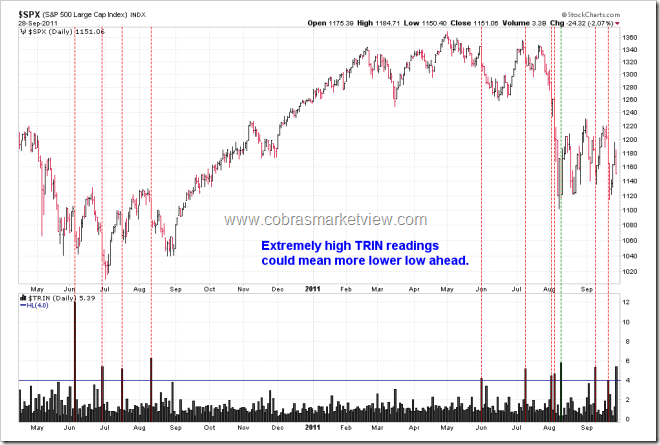
SHORT-TERM: MORE LIKELY THE LOW WASN’T IN YET
I see lots of extremes today, the easiest conclusion is most likely more lower low ahead (Please pay attention, when I say lower low, I mean lower than today’s low as the conclusion is drawn purely based on the chart. If I mean lower than Aug 9 lows, I’d say it clearly – break below Aug 9 lows. So such lower low calls have been correct for the past weeks and so did the higher high calls). Combining with all the blah blah mentioned in 09/23 Market Outlook and the statistics mentioned in 09/26 Market Outlook so chances are pretty high that the low wasn’t in yet. The good news is that the low might be very close, at least it’s a tradable bottom.
Let’s talk about good news first.
ISEE Index made a 52-week low today, closed at 53. From the chart below, highlighted in red, although it basically says more lower low ahead but the good news is 100% chances a green day tomorrow. Noted that the sample size is too small to make a solid conclusion though, only 6 out of 6.
CPC > 1.4, also argues for a lower low ahead, just it looks like at least a tradable bottom is very close whenever CPC reads above 1.4.
Listed below are all the other extremes I saw today, take a look, all are arguing for a lower low ahead.
INTERMEDIATE-TERM: SPX DOWNSIDE TARGET IS 1,000, THE CORRECTION COULD LAST 1 TO 2 MONTHS
See 08/19 Market Outlook for details.
SEASONALITY: BEARISH FRIDAY
According Stock Trader’s Almanac, last day of Q3, Dow down 9 of last 13, massive 4.7% rally in 2008.
See 09/02 Market Outlook for September seasonality.
SUMMARY OF SIGNALS FOR MY PUBLIC CHART LIST:
|
||||||||||||||||||||||||||||||
|
||||||||||||||||||||||||||||||
|


