|
||||||||||||||||||||||||||||||||||||||||||
|
||||||||||||||||||||||||||||||||||||||||||
|
||||||||||||||||||||||||||||||||||||||||||
|
INTERMEDIATE-TERM: INITIAL PULLBACK TARGET MET BUT COULD BE MORE
No update, see 02/05/2010 Market Recap, Fib 38.2% retracement target was met, but I suspect there’s more. There’s a chance that after the pullback is over, we’ll see a new high followed by a bigger pullback thereafter.
SHORT-TERM: NO CLEAR DIRECTION
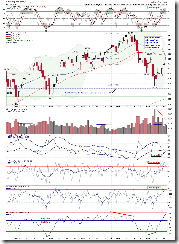
A Doji is formed in chart 0.0.2 SPY Short-term Trading Signals, which means either a reversal or a continuation, so the short-term direction is not clear. However from the table above, we can see that the short-term is a little bit overbought, plus as mentioned in today’s After Bell Quick Summary, a negative seasonality and so called “bearish Thursday”, so we might see a pullback tomorrow, I’m not sure though.
The most interesting thing today is that my stock screener found 50 candidates. As you might have noticed my stock screener usually can find only 1 candidate each day while it found 7 yesterday and 50 today. The stock screener uses three major scan conditions:
- In strong downtrend.
- Overbought.
- Bearish reversal bar (including filled black bar and hollow red bar).
So accordingly, 50 candidates found means a lot of stocks formed a bearish reversal bar today. Does this mean that the market is very close to a turning point? Well, we might know tomorrow.
STOCK SCREENER: For fun only, I may not actually trade the screeners. Since SPY ST Model is in SELL mode, only SHORT candidates are listed. For back test details as well as how to confirm the entry and set stop loss please read HERE. Please make sure you understand the basic risk management HERE.
Today’s screener has 50 stocks found.
According to the entry rule, GDX, HK, PSSI found yesterday were confirmed.


