|
||||||||||||||||||||||||||||||||||||||||||
|
||||||||||||||||||||||||||||||||||||||||||
|
||||||||||||||||||||||||||||||||||||||||||
|
INTERMEDIATE-TERM: IN WAIT AND SEE MODE
See 02/19/2010 Market Recap, not sure about the market direction, in wait and see mode.
SHORT-TERM: COULD SEE A NEW RECOVERY HIGH BUT LIKELY TO PULLBACK BIG THEREAFTER
The rebound today fits the post reversal bar pattern I mentioned in 02/22 Market Recap and 02/23 Market Recap. Now take a look at the most recent charts below, so far exactly repeats the past patterns, right?
So there could be a new recovery high (higher than the Monday high) tomorrow or Friday. The target could be to fill the gap above as illustrated in chart 1.0.2 S&P 500 SPDRs (SPY 60 min).
And after the new recovery high, if the past post reversal bar pattern still applies, there could be a bigger pullback. Below are 3 additional reasons to expect the pullback:
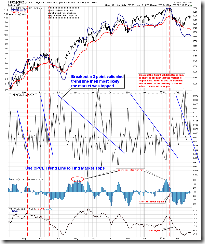
- 0.0.8 SPX:CPCE, the trend line held so the top could be confirmed now.
- 1.0.7 SPX Cycle Watch (Daily), 1.0.8 SPX Cycle Watch (Moon Phases), multiple cycle due date on March 1st, so up until March 1st, then March 1st could be a top.
- 6.4.7 NYSE Tick Watch (60 min), no -1,000 TICK readings for too long, so there could be a panic sell very soon. The Wednesday’s pullback was very special because there’s no -1,000 TICK readings while SPY dropped more than 1%. The past similar cases are: 01/12/2010, 01/09/2009 and 05/11/2009, check by yourself to see what had happened thereafter.
1.0.9 SPX Cycle Watch (60 min), just to remind, there’s a cycle due at 3:00pm ET so if the market keeps rising tomorrow, it could pullback right before the close.
STOCK SCREENER: For fun only, I may not actually trade the screeners. Since SPY ST Model is in BUY mode, only LONG candidates are listed. For back test details as well as how to confirm the entry and set stop loss please read HERE. Please make sure you understand the basic risk management HERE.
Since the intermediate-term direction is not clear, so no stock screeners from now on until the dust settles.


