|
||||||||||||||||||||||||||||||||||||||||||
|
||||||||||||||||||||||||||||||||||||||||||
|
||||||||||||||||||||||||||||||||||||||||||
|
INTERMEDIATE-TERM: IN WAIT AND SEE MODE
See 02/19/2010 Market Recap, not sure about the market direction, in wait and see mode.
SHORT-TERM: COULD BE ANOTHER REVERSAL DAY TOMORROW
0.0.2 SPY Short-term Trading Signals, I guess now everybody knows that a hollow red bar means a reversal. Unfortunately however, it’s hard to say the reversal bar today means a top or bottom.
0.0.5 QQQQ Short-term Trading Signals, the same, hard to say it’s a top or bottom.
3.4.2 Financials Select Sector SPDR (XLF Daily), another example, top or bottom?
So the conclusion is we need see a strong up tomorrow to prove that indeed the market was bottomed. Again unfortunately however, the chances for a strong up day are not very high tomorrow. There reasons:
1.0.2 S&P 500 SPDRs (SPY 60 min), ChiOsc too high which usually means a 4 hours pullback.
1.0.9 SPX Cycle Watch (60 min), there’re 2 cycle due tomorrow, so a gap up open tomorrow will look a lot like a cycle top, unless the market gap down sharply again tomorrow morning.
Take a look at statistics here: Recovery Days Revisited which also says tomorrow could open high but may close low. For the completeness of this report, I attached a screenshot below but the credit belongs to www.tradingtheodds.com.
The bottom line, as mentioned in the 02/24 Market Recap, according to chart 1.0.7 SPX Cycle Watch (Daily) and 1.0.8 SPX Cycle Watch (Moon Phases), there’re several cycle due dates next week, whether they mean a bottom or top may depend on the market’s actions tomorrow and the next Monday. Right now it’s too early to see clearly.
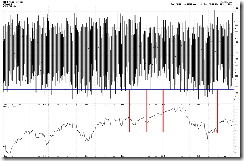
6.4.7 NYSE Tick Watch (60 min), since someone asked so I posted the chart below. If still there’s no -1,000 readings tomorrow then it’ll be the longest streak without a -1,000 TICK readings on the chart.
STOCK SCREENER: For fun only, I may not actually trade the screeners. Since SPY ST Model is in BUY mode, only LONG candidates are listed. For back test details as well as how to confirm the entry and set stop loss please read HERE. Please make sure you understand the basic risk management HERE.
Since the intermediate-term direction is not clear, so no stock screeners from now on until the dust settles.


