|
||||||||||||||||||||||||||||
|
||||||||||||||||||||||||||||
|
||||||||||||||||||||||||||||
|
INTERMEDIATE-TERM: RISE TO 03/08 THEN PULLBACK TO 03/16?
See 03/05 Market Recap as multiple Gann days are due around 03/08 and 03/16 and the market is pretty overbought so the logic guess is it could pullback from around 03/08 to around 03/16.
Overall according to the past II pattern, I believe eventually we’ll see a bigger correction. Just for now except for the Gann theory arguing that 03/08 could be a major top, I have no other evidences supporting an imminent big correction.
SHORT-TERM: OVERBOUGHT
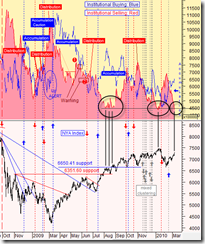
Still expect a pullback. Besides lots of overbought signals (See table above), the distribution (red) curve of the latest Institutional Buying and Selling Trending (courtesy of stocktiming) chart has reached an extremely low position again, see black lines, at least recently whenever the distribution curve was this low, there was a little big correction thereafter.
2.0.0 Volatility Index (Daily), the filled black bar could mean a reversal up which is not good for the stock market. By the way, VIX was down 17 out of the past 18 days which had never happened since 1990.
1.0.9 SPX Cycle Watch (60 min), just a reminder, there’re again 2 cycles due tomorrow intraday, mostly apply to very short-term though.
STOCK SCREENER: For fun only, I may not actually trade the screeners. Since SPY ST Model is in BUY mode, only LONG candidates are listed. For back test details as well as how to confirm the entry and set stop loss please read HERE. Please make sure you understand the basic risk management HERE.
Since the intermediate-term direction is not clear, so no stock screeners from now on until the dust settles.


