|
||||||||||||||||||||||||||||||||||||||||||||||||||||||||||||||||||||||||||||||||
|
||||||||||||||||||||||||||||||||||||||||||||||||||||||||||||||||||||||||||||||||
|
*Please make sure you understand how to use the table above. The main purpose of this report is to provide information so contradictory signals are always presented.
SEASONALITY: THE LATER HALF OF THE WEEK IS GENERALL BULLISH
According to the Stock Trader’s Almanac:
- 04/15 income tax deadline, Dow down only 5 times since 1981.
- April expiration day, Dow up 11 of last 13.
CYCLE ANALYSIS: CYCLE TOP COULD BE AROUND 04/11 TO 04/15
See 04/08 Market Recap for more details.
INTERMEDIATE-TERM: EXPECT ROLLER COASTER AHEAD
Nothing new, according to the II Survey, too many people expected a correction, so the stock market should rise to a new high first before actually pulling back. Basically, my guess is that we’ll repeat the year 2004 roller coaster pattern. See 03/19 Market Recap for more details.
SHORT-TERM: A STRONG EARNINGS OFF-SEASON USUALLY MEANS A WEAKER EARNINGS SEASON
See 04/09 Market Recap, the statistics about the Earnings Season plus the cycle analysis and plus too many bearish extremes accumulated in the table above, so my guess is that we’ll see typical sell on news in the coming earnings season.
Nothing to say today, although the bearish extremes keep piling up but the market simply keeps going up, I have no idea how this is going to end. If you really really want to catch this mad cow, see small tips market by “*” in the table above, trying currency, bond and commodity stuff may avoid the possible pullback on equities.
Some people are asking 6.2.2a VIX Trading Signals (BB), as it’s triggered today.
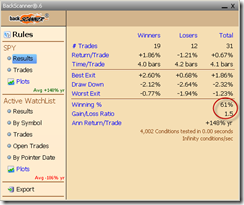
Officially when SPY ST Model is in buy mode, I won’t mention any short setup, except, of course, the NYMO Sell setup. Now since people want to know, well, below are some simple statistics, if sell short the next day open, cover at close on the 5th day (why the 5th day? Because it shows the best results!), winning rate is 61%, hmm, not very bad.
| % Change | Enter Date | Exit Date | Enter Price | Exit Price |
| -1.866252 | 11/19/2002 | 11/26/2002 | 90.02 | 91.7 |
| -1.990742 | 3/27/2003 | 4/2/2003 | 86.4 | 88.12 |
| -3.465456 | 4/17/2003 | 4/24/2003 | 88.3 | 91.36 |
| 2.765798 | 5/14/2003 | 5/20/2003 | 95.09 | 92.46 |
| 1.627718 | 7/29/2003 | 8/4/2003 | 100.14 | 98.51 |
| -1.014239 | 9/10/2003 | 9/16/2003 | 102.54 | 103.58 |
| 1.321736 | 1/23/2004 | 1/29/2004 | 115 | 113.48 |
| 1.820889 | 4/27/2004 | 5/3/2004 | 114.23 | 112.15 |
| 0.772945 | 10/5/2004 | 10/11/2004 | 113.85 | 112.97 |
| -1.096599 | 12/17/2004 | 12/23/2004 | 119.46 | 120.77 |
| 0.281827 | 12/28/2004 | 1/3/2005 | 120.64 | 120.3 |
| -0.621847 | 2/4/2005 | 2/10/2005 | 119 | 119.74 |
| 3.099454 | 4/14/2005 | 4/20/2005 | 117.44 | 113.8 |
| 1.734389 | 6/20/2005 | 6/24/2005 | 121.08 | 118.98 |
| -0.391169 | 7/19/2005 | 7/25/2005 | 122.71 | 123.19 |
| 1.373735 | 9/14/2005 | 9/20/2005 | 123.75 | 122.05 |
| -1.053922 | 11/7/2005 | 11/14/2005 | 122.4 | 123.69 |
| -0.26333 | 2/21/2006 | 2/27/2006 | 129.12 | 129.46 |
| 0.458078 | 3/16/2006 | 3/22/2006 | 130.98 | 130.38 |
| -0.37709 | 8/22/2006 | 8/28/2006 | 129.94 | 130.43 |
| -0.732762 | 10/17/2006 | 10/23/2006 | 136.47 | 137.47 |
| 1.046339 | 11/21/2006 | 11/28/2006 | 140.49 | 139.02 |
| 0.749963 | 9/20/2007 | 9/26/2007 | 153.34 | 152.19 |
| 2.791574 | 12/27/2007 | 1/3/2008 | 149.02 | 144.86 |
| 2.484701 | 2/28/2008 | 3/5/2008 | 137.24 | 133.83 |
| 3.620193 | 5/19/2008 | 5/23/2008 | 142.81 | 137.64 |
| 1.881687 | 4/14/2009 | 4/20/2009 | 85.03 | 83.43 |
| 2.814296 | 5/8/2009 | 5/14/2009 | 92.03 | 89.44 |
| -1.632013 | 5/21/2009 | 5/28/2009 | 89.46 | 90.92 |
| 4.700018 | 7/1/2009 | 7/8/2009 | 92.34 | 88 |
| 0.052653 | 1/13/2010 | 1/20/2010 | 113.95 | 113.89 |
| AVERAGE | 0.673954 |
The summary below is why I’ll only mention the same setup when SPY ST Model is in sell mode, because the winning rate is 100% (and that’s why to follow the trend is of the most importance). Well, I know the cases are too few to draw any solid conclusion though.
STOCK SCREENER: For fun only, I may not actually trade the screeners. Since SPY ST Model is in BUY mode, only LONG candidates are listed. For back test details as well as how to confirm the entry and set stop loss please read HERE. Please make sure you understand the basic risk management HERE.
Looks like it’s too late to long stocks now as the market is way too overbought. Waiting for a better chance.


