TREND INDICATOR MOMENTUM INDICATOR COMMENT (Click link to see chart)
Long-term 3 of 3 are BUY    
Intermediate 2 of 3 are SELL 3 of 5 are NEUTRAL Non-Stop Model is in BUY mode
Short-term 1 of 1 are SELL 6 of 6 are NEUTRAL SPY ST Model is in BUY mode
ATTENTION *1.0.6 SPY Unfilled Gaps: 17 unfilled up gaps. (max was 18)
0.1.1 SPX Intermediate-term Trading Signals: Could be an Ascending Broadening Wedge in the forming.
BULLISH 4.1.0 S&P 500 Large Cap Index (Weekly): Head and Shoulders Bottom, target 1246.
0.2.3 NYSE McClellan Oscillator: NYHGH new high could mean SPX new high ahead.
BEARISH 0.1.1 SPX Intermediate-term Trading Signals: CPCE MA(10) too low.
0.2.2 Extreme Put Call Ratio Watch: CPCE MA(5) too low.
4.0.4 Dow Theory: Averages Must Confirm: NYHILO too high.
4.1.0 S&P 500 Large Cap Index (Weekly): BPSPX too high.
CONCLUSION
SPY SETUP ENTRY DATE STOP LOSS INSTRUCTION: Mechanic signals, back test is HERE, signals are HERE.
TRADING VEHICLE:
SSO/SDS, UPRO/SPXU
ST Model *04/29 L 1.5xATR(10) *Be careful, don’t get too bullish, the uptrend is weakening.
Reversal Bar *04/29 L 0.9xATR(10)
NYMO Sell    
Non-Stop    
VIX MA ENV *04/29 L 1.0xATR(10)  
OTHER ETFs TREND TRADE COMMENT – *New update. Click BLUE to see chart if link is not provided.
QQQQ UP   4.1.1 Nasdaq 100 Index (Weekly): BPNDX overbought and too high above MA(200).
IWM UP   4.1.2 Russell 2000 iShares (IWM Weekly): Too high above MA(200).
CHINA DOWN  
EMERGING DOWN   Bearish 1-2-3 formation, target $39.90.
CANADA UP  
BOND ?   Testing important resistance, will upgrade to up from down if breakout.
DOLLAR UP FXE breakdown to new low!
GOLD UP  
GDX UP  
OIL ? $WTIC tests MA(50) again, will downgrade to down from up if breakdown.
ENERGY UP  
FINANCIALS DOWN   4.4.2 Financials Select Sector SPDR (XLF Weekly): Too high above MA(200).
Bearish 1-2-3 formation, target $15.29.
REITS UP
MATERIALS UP    

*Please make sure you understand how to use the table above. The main purpose of this report is to provide information so contradictory signals are always presented.

SEASONALITY: MOSTLY THE MONTH’S LAST TRADING WEEK WAS RED SINCE AUG 2009

See 04/23 Market Recap for more details.

CYCLE ANALYSIS: THE NEXT IMPORTANT DATE IS 05/06

The next potential turn date is 05/06 (+-) which could either be a top or a bottom depending on how the market marches to that date. See 04/16 Market Recap for more details.

INTERMEDIATE-TERM: EXPECT ROLLER COASTER AHEAD

See 04/26 Market Recap for more details.

SHORT-TERM: NASDAQ TRADERS GOT VERY EXCITED AGAIN

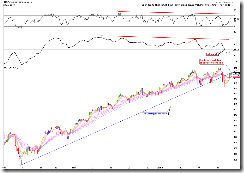
Tomorrow should be another key day for bulls, because from the chart 1.0.0 S&P 500 SPDRs (SPY 60 min), there’s a possibility that today was just a typical back test of the broken trend line, so if the market drops tomorrow then it’d make things a little bit complicated for bulls.

 SPY60min

I have no idea whether tomorrow will be up or down, just one thing I’d like to remind you: The Nasdaq traders got very excited today, maybe too excited, because there’s almost no minus TICK the whole day today (means nobody is selling only buyers left in the market) and therefore the Intraday Cumulative TICK (Courtesy of sentimentrader) skyrocketed again. A big WOW again, the last 2 times I WOW-ed was in 04/14 Market Recap and 04/20 Market Recap.

IntradayCumTick