|
||||||||||||||||||||||||||||||||||||||||||||||||||||||||||||||||||||||||||||||||||||||||||||
|
||||||||||||||||||||||||||||||||||||||||||||||||||||||||||||||||||||||||||||||||||||||||||||
|
*Please make sure you understand how to use the table above. The main purpose of this report is to provide information so contradictory signals are always presented.
*DTFMS = Dual Time Frame Momentum Strategy. The signal is given when both weekly and daily STO have the same buy/sell signals.
SEASONALITY: THE LAST TRADING WEEK OF MONTH WAS BEARISH SINCE AUG 2009
See 05/21 Market Recap for more details.
INTERMEDIATE-TERM: PULLBACK TARGET AROUND 1008 TO 1019, NEXT TIME WINDOW AROUND 06/06
1.1.1 NYSE Composite Index Breadth Watch, in yesterday’s report, I mentioned 2 possibilities (see 05/26 Market Recap for more details):
- Rebound immediately starting from today then after that one more leg down to form a positive divergence before bottoming.
- Keep dropping for a few days to form a bottom directly.
Looks like the market chose to rebound immediately today. Since the positive divergence is still missing, so there could be an one more leg down ahead, therefore I will temporarily maintain the intermediate-term target around 1008 to 1019 (See 05/21 Market Recap for more details).
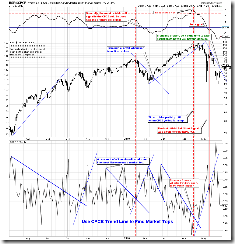
0.0.2 Combined Intermediate-term Trading Signals, if you simply follow the the Non-Stop model, it has only 48% winning rate, but if you could take a partial profit in the middle then the winning rate could go as high as 70%. Take a look at the chart below, the simplest way to know when to take a partial profit is whenever a DESCEN trend line is broken. Now it’s about the time, if you haven’t taken any profit before. Don’t let a profit turn into a loss.
WARNING: If you don’t understand the true meaning of overbought/oversold, please skip the session below. Generally, you should try your best not to trade against the trend. Trading purely based on overbought/oversold while against the trend is lethal to the health of your account. Before going further, please make sure you understand how to use the table above.
SHORT-TERM: COULD REBOUND TO AROUND 06/06 (+-), SPY TARGET $114.40
6.3.1 Major Accumulation Day Watch, one more bottom signal today – 2 Major Accumulation Day (NYSE Up Volume to NYSE Down Volume > 9) within 5 days. See dashed green lines, with no exception, there’s a good rally thereafter. I weight a lot on this signal, plus lots of bottom signals already piled up in the table above, so it looks very likely the market has bottomed, well, at least for the short-term. There’s a catch though. See NYMO at the bottom, unlike all the past cases, a visible positive divergence is still missing, so similar to mentioned above in the intermediate-term session, this could mean that there’ll be one more down leg ahead. Just for now, let’s temporarily pretend not to see it.
If indeed the market has bottomed, then the rebound target could be SPY $114.40 and the time could last to 06/06 (+-). Trading wise, I’ve already mentioned in today’s After Bell Quick Summary, because in the table above, both short-term and intermediate-term are still arguing for sell, so the strategy is still to sell the bounce, just be very very careful here.
1.0.1 S&P 500 SPDRs (SPY 15 min), this is how I get the rebound target. Head and Shoulders Bottom, the text book target is around $114.40. There’re 74%chances the target will be met.
As for the time target, in 05/21 Market Recap, I mentioned the next time window is around 06/06. Also from the chart below, at least there could be 3 more trading days left for the up swing which could end to around 06/03 which is very close to 06/06.
Intraday Cumulative TICK from sentimentrader, record WOW today! I really don’t know how to explain this. If simply repeats the past 6 WOWs (See 05/18 Market Recap, 05/12 Market Recap, 05/03 Market Recap, 04/29 Market Recap, 04/20 Market Recap and 04/14 Market Recap) then we should see a big pullback very soon. Personally, I still think it just reflects a certain trading behavior changes, so doesn’t mean that people are way too bullish therefore the market is destined to have a pullback. Well, we’ll see.


