|
||||||||||||||||||||||||||||||||||||||||||||||||||||||||||||||||||||||||||||||||||||
|
||||||||||||||||||||||||||||||||||||||||||||||||||||||||||||||||||||||||||||||||||||
|
*Please make sure you understand how to use the table above. The main purpose of this report is to provide information so contradictory signals are always presented.
*DTFMS = Dual Time Frame Momentum Strategy. The signal is given when both weekly and daily STO have the same buy/sell signals. Use it as a filter, don’t trade directly.
SEASONALITY: WEEK AFTER JUNE TRIPLE WITCHING WAS BEARISH
According to the Stock Trader’s Almanac, week after June Triple Witching, Dow down 10 in a row and 17 of last 19.
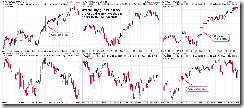
The chart below is from sentimentrader, it seems the next week will be the SPX’s most bearish week in June.
INTERMEDIATE-TERM: INITIAL REBOUND TARGET AROUND 1150 AND TIME TARGET AROUND 06/24
See 06/14 Market Recap for more details.
SHORT-TERM: A LITTLE LITTLE LITTLE BEARISH TOWARD NEXT WEEK
The bottom line, the trend is up but I’m a little little little bearish biased toward the next week. The reason, besides as mentioned in the seasonality session above – statistically the next week was bearish, there’re 2 additional reasons:
0.1.0 SPY Short-term Trading Signals, hollow red bar plus solid black bar plus solid black bar, 3 reversal bars in a row, it doesn’t look good.
The chart below listed all the cases since the year 2000, when SPY had a similar 3 hollow red bar plus solid black bar (doesn’t matter whichever comes first) in a row. Among the total 7 cases, 1 case, SPY simply skyrocketed high without looking back, 2 cases, SPY had a little consolidation before deciding to fly to the sky and the rest 4 cases were at least a short-term top. Well, not as bearish as I originally thought but if you shorted near the Friday’s close and your luck is not too bad (1 out of 7) then the next week, you may at least have a chance to escape without losing a single bear hair.
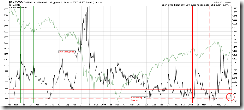
Another reason I’m a little little little bearish toward the the next week is the weekly VIX dropped more than 25% in 2 weeks. Since the year 2000, there’re 10 such cases, among them 7 had a red next week (red dashed lines) and also 7 were either a short-term top or just a week or 2 away from a short-term top.
0.1.2 QQQQ Short-term Trading Signals, 2 solid black bars under MA(50), doesn’t look good. However it’s difficult to do the back test, so if interested, take a look at the chart from 8.2.9a QQQQ – 2000 to 8.2.9k QQQQ – 2010 to see what the chances are to break through the MA(50) on the first attempt when rebounds from a multiple weeks low.
6.2.3 VIX:VXV Trading Signals, just want to remind you of this chart, if Monday rises really really huge, bears may not need to be panic because chances are good that VIX to VXV ratio would reach a record low and if so, I don’t think the market could go too high.


