|
||||||||||||||||||||||||
|
||||||||||||||||||||||||
|
*Please make sure you understand how to use the table above. The purpose of this report is to provide info so contradictory signals are always presented.
SHORT-TERM: COULD SEE MORE PULLBACKS
A few top signs I see today, could mean either short-term or intermediate-term top. However if you’ve paid attention to my TICK MA(3) chart mentioned recently, the pullback today was expected. And if we saw a day or two sharp sell off thereafter, still it’s expected. So I’ll maintain the 3 leg up forecast for the intermediate-term. The main reason, still is a strong up momentum like we saw in the past few days won’t simply be reversed immediately unless something terribly terrible happens.
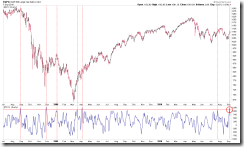
I’ve mentioned what the most worried me today in the After Bell Quick Summary: CPCI closed at an extremely high level which usually means big guys knew something ahead of our retailers therefore they bought a lot put to hedge their long positions. Well, I know you’d ask then what’s in the mind of the other big guys who sold such large put positions? Well, I don’t know and don’t care, the chart below should clear what CPCI very high means to us recently.
The very high CPCI also made the VIX and SPX on the same EMA(20) side which is another potential trend change signal.
0.2.5 NYSE Total Volume, too low, another top sign.
6.2.2a VIX Trading Signals (BB), the short setup was triggered today, see 04/13 Market Recap for back test results.
1.0.6 SPY Unfilled Gaps, just to show you something interesting, doesn’t mean bullish or bearish. I’ve been mentioning back to back unfilled gaps are rare therefore they should be filled within day recently. Today a back to back unfilled gap was formed, and if we have a gap up unfilled tomorrow, then we’d see back to back unfilled gaps on both upside and downside. Interesting? Well, let’s see.
INTERMEDIATE-TERM: EXPECT 3 LEG UP, MINI SPX 100 POINT FROM 08/27 CLOSE
See 09/03 Market Recap for more details.
SEASONALITY: SEPTEMBER IS BEARISH
See 09/03 Market Recap for more details.
HIGHLIGHTS OF THE OTHER ETFS IN MY PUBLIC CHART LIST
*I’ve changed the trend indicator, now it should respond much faster.
| TREND | DTFMS | COMMENT – *New update. Click BLUE to see chart if link is not provided. | |
| QQQQ | UP | ||
| IWM | *LA | ||
| CHINA | UP | Head and Shoulders Bottom in the forming? | |
| EMERGING | *LA | 4.1.6 iShares MSCI Emerging Markets (EEM Weekly): EEM to SPX ratio too high. | |
| EUROPEAN | *DOWN | ||
| CANADA | UP | ||
| BOND | *UP | SELL | 4.2.0 20 Year Treasury Bond Fund iShares (TLT Weekly): Too far away from MA(200). |
| EURO | *DOWN | ||
| GOLD | *UP | ||
| GDX | UP | 4.3.1 Market Vectors Gold Miners (GDX Weekly): GDX to SPX ratio too high, pullback? *3.2.0 streetTRACKS Gold Trust Shares (GLD Daily): Black bar, pullback? |
|
| OIL | *LA | BUY | 4.4.0 United States Oil Fund, LP (USO Weekly): USO to SPX ratio too low, rebound? |
| ENERGY | *LA | ||
| FINANCIALS | *LA | 4.4.2 Financials Select Sector SPDR (XLF Weekly): Head and Shoulders Top in the forming? | |
| REITS | *LA | 4.4.3 Real Estate iShares (IYR Weekly): Home builder is lagging and IYR to SPX ratio too high. | |
| MATERIALS | UP |
*DTFMS = Dual Time Frame Momentum Strategy. The signal is given when both weekly and daily STO have the same buy/sell signals. Use it as a filter, don’t trade directly.
*LA = Lateral Trend.


