|
||||||||||||||||||||||||
|
||||||||||||||||||||||||
|
*Please make sure you understand how to use the table above. The purpose of this report is to provide info so contradictory signals are always presented.
SHORT-TERM: NO IDEA, COULD SEE MORE PUSH UP?
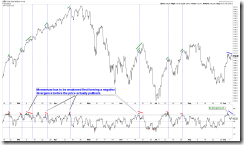
I don’t see anything worth blah blah today, so have to see tomorrow. Since there’re a few potential top signals in the table above plus we’re now in the 09/07 to 09/10 time window, so beware of the risk of at least a short-term pullback. However, because of the potential Bull Flag mentioned in today’s After Bell Quick Summary so there’s still a chance that the market would make at least one more push up before pulling back. The chart below shows another reason for expecting one more push up: No RSI negative divergence yet.
As mentioned in yesterday’s report, indeed back to back unfilled gaps were formed on both upside and downside. I expect to be filled pretty soon, the only question is who gets filled first? Again no idea, let’s see tomorrow.
INTERMEDIATE-TERM: EXPECT 3 LEG UP, MINI SPX 100 POINT FROM 08/27 CLOSE
See 09/03 Market Recap for more details.
SEASONALITY: SEPTEMBER IS BEARISH
See 09/03 Market Recap for more details.
HIGHLIGHTS OF THE OTHER ETFS IN MY PUBLIC CHART LIST
| TREND | DTFMS | COMMENT – *New update. Click BLUE to see chart if link is not provided. | |
| QQQQ | UP | ||
| IWM | LA | ||
| CHINA | UP | Head and Shoulders Bottom in the forming? | |
| EMERGING | *UP | 4.1.6 iShares MSCI Emerging Markets (EEM Weekly): EEM to SPX ratio too high. | |
| EUROPEAN | *LA | ||
| CANADA | *DOWN | ||
| BOND | *LA | 4.2.0 20 Year Treasury Bond Fund iShares (TLT Weekly): Too far away from MA(200). | |
| EURO | DOWN | ||
| GOLD | *LA | *SELL | |
| GDX | *DOWN | 4.3.1 Market Vectors Gold Miners (GDX Weekly): GDX to SPX ratio too high, pullback? *3.2.0 streetTRACKS Gold Trust Shares (GLD Daily): Double black bar, pullback? |
|
| OIL | LA | 4.4.0 United States Oil Fund, LP (USO Weekly): USO to SPX ratio too low, rebound? | |
| ENERGY | LA | ||
| FINANCIALS | LA | 4.4.2 Financials Select Sector SPDR (XLF Weekly): Head and Shoulders Top in the forming? | |
| REITS | LA | 4.4.3 Real Estate iShares (IYR Weekly): Home builder is lagging and IYR to SPX ratio too high. | |
| MATERIALS | UP |
*DTFMS = Dual Time Frame Momentum Strategy. The signal is given when both weekly and daily STO have the same buy/sell signals. Use it as a filter, don’t trade directly.
*LA = Lateral Trend.


