|
||||||||||||||||||||||||
|
||||||||||||||||||||||||
|
P.S. The weekend report is delayed because I spent lots of time on Mechanical Trading Systems for ETFs. From now on I’ll give those signals in the ETF table at the end of my daily recap. I think this is one step forward for an objective analysis which unlike before that I had to manually judge if the trend was up or down and because of different time frame, the info was rather useless and in case you’ve noticed that I’ve vacillated between different ways of giving specific signals for quite a long time. I sure hope this’d be the last time I vacillate around.
SHORT-TERM: CONSOLIDATION, THE DIRECTION IS NOT CLEAR, BUT I’M BEARISH BIASED
SPX has been fluctuating around 1184 for 2 weeks, most likely after the FOMC the next week, the range will be broken. Although theoretically a breakout from a consolidation range is bilateral but from the chart below, looks to me a consolidation was generally not good for bulls. I hope you still remember in 10/05 Market Recap, I mentioned a 16 trading day up swing after the 10/05 breakout. Well, it’s fulfilled on 10/27 and now we have another 7 bar consolidation…
From the weekly chart below, obviously it’s now way too stretched, so bet on a huge up the next week may need some imagination (and I sure hope YES WE CAN could deliver so that I could retire earlier on a yacht of my dream).
Time analysis also argues that the next pivot high could range from 11/04 to 11/08 for 5 reasons:
- Multiple Gann Day due from 11/04 to 11/08.
- Day 6 of each month since year 2000 was more likely a pivot day.
- New Moon on 11/06.
- Solar Term date on 11/07.
- Non Farm Payroll on 11/05 which according to 6.5.1b SPX and NFP was more likely a pivot day.
Also according to the chart above, there’s a possibility that the pivot high was already in on 10/25. Personally, I’m not sure about this, because from Euro chart below, it looks more likely there’s one more push up ahead, although judging from the UUP volume surge, the push up might be the final push. The 3rd possibility on the chart above is to up until at least 11/12 and SPX 1215, for this, since it’s after 11/04 so we may have to discuss this later.
So to summarize above, the pivot high could be in the next week (or early the next next week). I expect a pullback of some kind. And whether the pullback is for short-term or intermediate-term, we’ll have to wait and see.
INTERMEDIATE-TERM: BEARISH BIASED, PIVOT DATE EITHER ON 10/25 OR AROUND 11/04
Maintain the intermediate-term bearish view. We may have passed the pivot day on 10/25 or the next pivot day could be 11/04. Below are summaries of all the arguments supporting my intermediate-term bearish view:
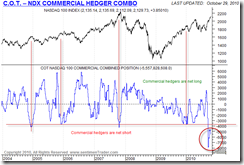
- As mentioned in 10/15 Market Recap, commercial (smart money) holds record high short positions against Nasdaq 100.
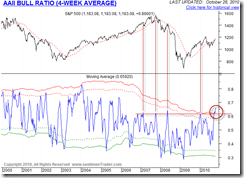
- As mentioned in 10/15 Market Recap, AAII bull ratio (4-week average) is way too bullish.
- As mentioned in 10/22 Market Recap, institution selling keeps increasing.
- As mentioned in 10/08 Market Recap, statistically, a strong off-season could mean a weaker earning season.
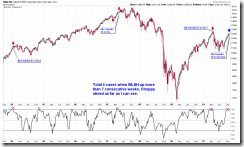
- As mentioned in 10/22 Market Recap, NYSI Weekly STO(5,3,3) sell signal means choppy ahead.
Below are some of the most recent charts mentioned above.
SEASONALITY: LAST 2 MONTHS OF YEAR ARE BULLISH
The chart below is from Bespoke, should be clear enough.
HIGHLIGHTS OF THE OTHER ETFS IN MY PUBLIC CHART LIST
| SIGNAL | COMMENT | |
| QQQQ | 10/15 L | |
| NDX Weekly | %B too high with negative divergence. NASI weekly STO(5,3,3) sell signal. | |
| IWM | ||
| IWM Weekly | ||
| CHINA | 07/15 L | Primary downtrend line breakout not confirmed. |
| CHINA Weekly | *High %B with negative divergence plus stalled under primary bear trend line. Pullback? | |
| EEM | *Could be a Symmetrical Triangle in the forming, so one more push up? | |
| EEM Weekly | ||
| XIU.TO | 08/31 L | |
| XIU.TO Weekly | Testing Fib 61.8%. | |
| TLT | 1-2-3 trend change confirmed, the intermediate-term trend is down. ChiOsc is too low though. | |
| TLT Weekly | ||
| FXE | *Could be a Symmetrical Triangle in the forming, so one more push up? Pay attention to volume surge on UUP, US$ may very close to a bottom. |
|
| FXE Weekly | Stalled at Fib confluences area. | |
| GLD | *Watch for potential 1-2-3 trend change! Bump and Run Reversal in the forming? | |
| GLD Weekly | ||
| GDX | 10/29 L | *Watch for potential 1-2-3 trend change! |
| GDX Weekly | ||
| USO | *Could be a Bull Flag in the forming. | |
| WTIC Weekly | ||
| XLE | 6/15 L | |
| XLE Weekly | %B too high with negative divergence. | |
| XLF | 10/15 L | |
| XLF Weekly | Head and Shoulders Top in the forming? | |
| IYR | *Testing trend line support. | |
| IYR Weekly | Home builders are lagging. | |
| XLB | 10/20 S | |
| XLB Weekly |
- Please make sure you understand how to use the table above. The purpose of this report is to provide info so contradictory signals are always presented.
- Position reported in short-term session of the table above is for short-term model only, I may or may not hold other positions which will not be disclosed.
- Conclusions can be confirmed endlessly, but trading wise, you have to take actions at certain risk level as soon as you feel the confirmation is enough. There’s no way for me to adapt to different risk levels therefore no trading signals will be given in this report except the mechanical signals such as SPY ST Model.
- * = New update; Blue Text = Link to a chart in my public chart list
- Trading signals in OTHER ETFs table are mechanical signals. See HERE for back test results.


