|
||||||||||||||||||||||||
|
||||||||||||||||||||||||
|
SHORT-TERM: BEWARE OF POSSIBLE 2.5%+ CORRECTIONS
If you paid attention to the pattern mentioned in 11/05 Market Recap about SPX daily bar completely out of BB, then you won’t be surprised about today’s small pullback, because 8 out of 12 cases since 1991, the day after an out of BB day was a red day. Take a look again on all the cases below for what likely is to happen after today. At least it looks to me more small pullbacks are more likely.
Although, my guess is that nobody would believe the SPX would ever pullback a little little bigger, but still I’d like to remind you that we’re in a now or never time window. See chart below, since 1991, interestingly, the straight up without 2.5%+ pullbacks usually lasted 48 to 61 trading days. And now we’ve had 50 trading days without 2.5%+ pullbacks. So odds are that a little bit bigger pullback would happen within 2 weeks. Again, this is a now or never time window which in another word is if we had no 2.5%+ pullbacks for more than 61 trading days then chances are that the market would be up straight for 148 trading days without 2.5%+ pullbacks. By the way, the time window for a little bigger pullback within 2 weeks also fits well what I mentioned in 11/05 Market Recap calling for 70%+ chances a red week this or the next week.
Besides the time window mentioned above, the SPY ST Model also gives a warning today, asking to tighten the stop loss to below the low of today. See chart below for what happened thereafter when SPY ST Model gave such kind of warnings. Judging by the past performance, the warning does deserve some credits, so be careful.
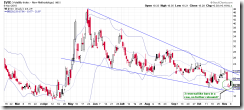
0.2.0 Volatility Index (Daily), the 3rd thing needs attention today is VIX had 3 consecutive reversal like bars, so it could rebound which means that SPX may pullback.
INTERMEDIATE-TERM: SPX MAY SHOOT HIGH THEN FALL BACK TO WHERE IT STARTS WHICH USUALLY IS THE 2ND BUY OPPORTUNITY
See 11/05 Market Recap for more details.
SEASONALITY: LAST 2 MONTHS OF YEAR ARE BULLISH
See 10/29 Market Recap for more details.
HIGHLIGHTS OF THE OTHER ETFS IN MY PUBLIC CHART LIST
| SIGNAL | COMMENT | |
| QQQQ | 10/15 L | |
| NDX Weekly | UP | %B too high with negative divergence. NASI STO(5,3,3) sell signal. NDX:SPX too high. Too far away from MA(200) (PPO(1,40,1) too high). |
| IWM | ||
| IWM Weekly | UP | |
| CHINA | 07/15 L | |
| CHINA Weekly | UP | |
| EEM | *ChiOsc is too high with 2 hollow red bars. | |
| EEM Weekly | UP | EEM:SPX too high. |
| XIU.TO | 08/31 L | TOADV MA(10) too high. |
| XIU.TO Weekly | UP | |
| TLT | ChiOsc is too low. *Red bar plus black bar, all had led to a rebound recently. Interesting. |
|
| TLT Weekly | DOWN | |
| FXE | ||
| FXE Weekly | UP | |
| GLD | ||
| GLD Weekly | UP | |
| GDX | 10/29 L | *ChiOsc is too high. |
| GDX Weekly | UP | BPGDM too high, pullback? |
| USO | ||
| WTIC Weekly | UP | |
| XLE | 06/15 L | |
| XLE Weekly | UP | |
| XLF | 10/15 L | Complex Head and Shoulders Bottom or Double Bottom breakout, target $16.74. |
| XLF Weekly | UP | |
| IYR | ||
| IYR Weekly | UP | Home builders are lagging. |
| XLB | 11/02 L | |
| XLB Weekly | UP | BPMATE overbought. XLB:SPX a little too high. |
- Please make sure you understand how to use the table above. The purpose of this report is to provide info so contradictory signals are always presented.
- Position reported in short-term session of the table above is for short-term model only, I may or may not hold other positions which will not be disclosed.
- Conclusions can be confirmed endlessly, but trading wise, you have to take actions at certain risk level as soon as you feel the confirmation is enough. There’s no way for me to adapt to different risk levels therefore no trading signals will be given in this report except the mechanical signals such as SPY ST Model.
- * = New update; Blue Text = Link to a chart in my public chart list.
- Trading signals in OTHER ETFs table are mechanical signals. See HERE for back test results. 08/31 L, for example, means Long on 08/31.
- UP = Intermediate-term uptrend. Set when I see at least one higher high and higher low on weekly chart.
- DOWN = Intermediate-term downtrend. Set when I see at least one lower high and lower low on weekly chart.


