|
||||||||||||||||||||||||
|
||||||||||||||||||||||||
|
SHORT-TERM: TRADADABLE BOTTOM BUT MAY JUST BE A RETEST OF THE SPX 11/05 HIGHS BEFORE ROLLOVER AGAIN
As mentioned in 11/29 Market Recap, decisively breakout above SPX 1200 would confirm the low was in. And today we got this much anticipated confirmation with solid evidences supporting more upside room ahead. Also as mentioned in 11/29 Market Recap, now there’re 2 possibilities:
- Wave 5 up to SPX 1300+.
- Retest the SPX 11/05 highs before rollover again.
Whichever it’ll be depends on whether SPX 11/05 highs could be decisively broken. So now the next point to watch is SPX 1227. Personally, I’d temporarily lean on that this is just a retest of the SPX 11/05 highs. As for why, I also has hinted in 11/29 Market Recap: put call ratio is way too crazy now.
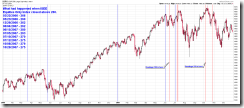
Let’s begin with why there’s more upside room ahead? Besides the reason given by today’s After Bell Quick Summary (basically it’s the Law of Inertia, neither should we short huge green bar nor long huge red bar), from the chart below we can see, 2 Major Accumulation Days within 5 trading days, with no exceptions, means at least a tradable bottom, if it’s not an intermediate-term bottom.
Then, why I temporarily lean on that this is just a retest of the SPX 11/05 highs? Because ISEE Equities Only Index is crazy today with readings surged to 327, which in another word is that retailers “call buy to open” is 3 times as much as “put buy to open”. The similar cases happened around the April top this year, when ISEE Equities Only Index made a record high readings at 348. Granted, just one day spike may mean nothing and that’s why I said “temporarily”. But at least it reminds us that from now on we need pay close attention to the ISEE Equities Only Index or whatever sentiment indicators. If they keep crazy then chances are very high that this is just a retest of the SPX 11/05 highs. The charts below listed all the past cases when ISEE Equities Only Index >= 260 for your references.
INTERMEDIATE-TERM: 2 MAJOR DISTRIBUTION DAYS WITIN 5 DAYS MEANS MORE PULLBACKS AHEAD
The intermediate-term is in danger of entering a downtrend. See 11/23 Market Recap for more details.
SEASONALITY: MONDAY AND TUESDAY BEARISH, WEDNESDAY (12/01) BULLISH, WHOLE WEEK BEARISH
See 11/26 Market Recap for more details. For November seasonality chart please refer to 11/11 Market Recap for more details.
HIGHLIGHTS OF THE OTHER ETFS IN MY PUBLIC CHART LIST
| SIGNAL | COMMENT | |
| QQQQ | 11/16 S | |
| NDX Weekly | UP | NASI STO(5,3,3) sell signal. |
| IWM | ||
| IWM Weekly | UP | IWM:SPX too high. |
| CHINA | ||
| CHINA Weekly | UP | |
| EEM | ||
| EEM Weekly | UP | |
| XIU.TO | 11/16 S | |
| XIU.TO Weekly | UP | |
| TLT | ||
| TLT Weekly | DOWN | |
| FXE | ||
| FXE Weekly | DOWN | |
| GLD | ||
| GLD Weekly | UP | |
| GDX | 11/16 S | |
| GDX Weekly | UP | |
| USO | ||
| WTIC Weekly | UP | |
| XLE | 06/15 L | |
| XLE Weekly | UP | |
| XLF | 10/15 L | |
| XLF Weekly | UP | |
| IYR | Could be a Bear Flag in the forming. | |
| IYR Weekly | UP | Home builders are lagging. |
| XLB | *12/01 L | |
| XLB Weekly | UP |
- Please make sure you understand how to use the table above. The purpose of this report is to provide info so contradictory signals are always presented.
- Position reported in short-term session of the table above is for short-term model only, I may or may not hold other positions which will not be disclosed.
- Conclusions can be confirmed endlessly, but trading wise, you have to take actions at certain risk level as soon as you feel the confirmation is enough. There’s no way for me to adapt to different risk levels therefore no trading signals will be given in this report except the mechanical signals such as SPY ST Model.
- * = New update; Blue Text = Link to a chart in my public chart list.
- Trading signals in OTHER ETFs table are mechanical signals. See HERE for back test results. 08/31 L, for example, means Long on 08/31.
- UP = Intermediate-term uptrend. Set when I see at least one higher high and higher low on weekly chart.
- DOWN = Intermediate-term downtrend. Set when I see at least one lower high and lower low on weekly chart.


