|
||||||||||||||||||||||||
|
||||||||||||||||||||||||
|
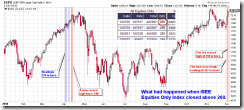
SHORT-TERM: COULD BE WAVE 5 UP TO SPX 1300+, NEED WATCH THE CRAZY ISEE EQUITIES ONLY INDEX CLOSELY
Two points for your consideration:
- The follow through today is very very strong which normally can only be seen at an important bottom, so about the 2 possibilities mentioned in 12/01 Market Recap, now wave 5 up to SPX 1300+ has much higher odds.
- ISEE Equities Only Index still is very crazy (see 12/01 Market Recap for the past record), today’s reading at 296 is the 3rd record high, so we need watch this index closely. This crazy index readings perhaps is the bear’s best hope.
Tomorrow is again the famous Non Farm Payroll day, I’d like your attention for two points as well:
- Generally bullish.
- General intraday pattern is open high closes lower or open low closes higher. (The intraday chart below is courtesy of Bespoke)
INTERMEDIATE-TERM: COULD BE WAVE 5 UP TO SPX 1300+, NEED WATCH THE CRAZY ISEE EQUITIES ONLY INDEX CLOSELY
No new update, see short-term session above.
SEASONALITY: MONDAY AND TUESDAY BEARISH, WEDNESDAY (12/01) BULLISH, WHOLE WEEK BEARISH
See 11/26 Market Recap for more details. For November seasonality chart please refer to 11/11 Market Recap for more details.
HIGHLIGHTS OF THE OTHER ETFS IN MY PUBLIC CHART LIST
| SIGNAL | COMMENT | |
| QQQQ | *12/02 L | |
| NDX Weekly | UP | NASI STO(5,3,3) sell signal. |
| IWM | ||
| IWM Weekly | UP | IWM:SPX too high. |
| CHINA | ||
| CHINA Weekly | UP | |
| EEM | ||
| EEM Weekly | UP | |
| XIU.TO | *12/02 L | |
| XIU.TO Weekly | UP | |
| TLT | ||
| TLT Weekly | DOWN | |
| FXE | ||
| FXE Weekly | DOWN | |
| GLD | ||
| GLD Weekly | UP | |
| GDX | *12/02 L | |
| GDX Weekly | UP | |
| USO | ||
| WTIC Weekly | UP | |
| XLE | 06/15 L | *ChiOsc is a little too high. |
| XLE Weekly | UP | |
| XLF | 10/15 L | |
| XLF Weekly | UP | |
| IYR | Could be a Bear Flag in the forming. | |
| IYR Weekly | UP | Home builders are lagging. |
| XLB | 12/01 L | *ChiOsc is a little too high. |
| XLB Weekly | UP |
- Please make sure you understand how to use the table above. The purpose of this report is to provide info so contradictory signals are always presented.
- Position reported in short-term session of the table above is for short-term model only, I may or may not hold other positions which will not be disclosed.
- Conclusions can be confirmed endlessly, but trading wise, you have to take actions at certain risk level as soon as you feel the confirmation is enough. There’s no way for me to adapt to different risk levels therefore no trading signals will be given in this report except the mechanical signals such as SPY ST Model.
- * = New update; Blue Text = Link to a chart in my public chart list.
- Trading signals in OTHER ETFs table are mechanical signals. See HERE for back test results. 08/31 L, for example, means Long on 08/31.
- UP = Intermediate-term uptrend. Set when I see at least one higher high and higher low on weekly chart.
- DOWN = Intermediate-term downtrend. Set when I see at least one lower high and lower low on weekly chart.


