|
||||||||||||||||||||||||
|
||||||||||||||||||||||||
|
||||||||||||||||||||||||
|
SHORT-TERM: BEAR FINALLY TOOK ITS FIRST STEP BUT STILL TOO EARLY TO DECLARE A TREND CHANGE
OK, we’ve got a 1%+ down day and close almost low of day, the question is: What’s next?
Generally, if indeed this is an important top, we should see a reversal of reversal of reversal, so at least the 01/18 highs will be retested, could be a lower high or a slightly higher high, if, however, the rebound decisively breaks above 01/18 highs then bears still have no hope. So, let’s see how the market rebounds first. For now it’s too early to say anything.
1.3.0 Russell 2000 iShares (IWM Daily), I think this could be a real concern for bulls, because looks like a big red bar more likely means more pullbacks ahead, while an underperforming Russell 2000 usually puts more pressure on the overall market, so pay attention here.
INTERMEDIATE-TERM: COULD BE WAVE 5 UP TO SPX 1300+, PIVOT TOP COULD BE AROUND 01/05 TO 01/12
The price and time target I’ve been blah blah for the intermediate-term has finally been met, although the time target seems a little too early but let’s give it another week to see whether the forecast is good or bad. See 01/14 Market Recap for more details.
SEASONALITY: BULLISH TUESDAY, BEARISH FRIDAY, HORRIBLE WHOLE WEEK
See 01/14 Market Recap for more details. Also see 12/31 Market Recap for the January seasonality chart.
HIGHLIGHTS OF THE OTHER ETFS IN MY PUBLIC CHART LIST
| SIGNAL | COMMENT | |
| QQQQ | 01/10 L | |
| NDX Weekly | UP | Too far away from MA(200) and BPNDX is way too overbought. |
| IWM | ||
| IWM Weekly | UP | |
| CHINA | ||
| CHINA Weekly | UP | Should have set the trend to down from up but I’ll see how the market rebounds. |
| EEM | ||
| EEM Weekly | UP | |
| XIU.TO | 01/06 S | |
| XIU.TO Weekly | UP | Weekly Bearish Engulfing, be careful. |
| TLT | 0.2.1 10Y T-Bill Yield: Symmetrical Triangle? So bond should keep falling? | |
| TLT Weekly | UP | |
| FXE | ||
| FXE Weekly | DOWN | |
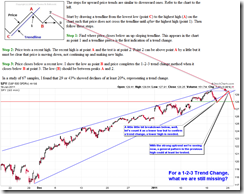
| GLD | 1-2-3 trend change, wait for further confirm, GLD may fall into a downtrend. | |
| GLD Weekly | UP | |
| GDX | 12/17 S | 1-2-3 trend change confirmed, so GDX could be topped. Be careful about gold itself. |
| GDX Weekly | DOWN | |
| USO | ||
| WTIC Weekly | UP | |
| XLE | 06/15 L | Too far away from MA(200). |
| XLE Weekly | UP | |
| XLF | 10/15 L | |
| XLF Weekly | UP | Testing resistance which also is multiple Fib confluences area. |
| IYR | ||
| IYR Weekly | UP | |
| XLB | *01/19 S | |
| XLB Weekly | UP | BPMATE is way too overbought. |
- Please make sure you understand how to use the table above. The purpose of this report is to provide info so contradictory signals are always presented.
- Conclusions can be confirmed endlessly, but trading wise, you have to take actions at certain risk level as soon as you feel the confirmation is enough. There’s no way for me to adapt to different risk levels therefore no trading signals will be given in this report except the mechanical signals such as SPY ST Model.
- * = New update; Blue Text = Link to a chart in my public chart list.
- Trading signals in OTHER ETFs table are mechanical signals. See HERE for back test results. 08/31 L, for example, means Long on 08/31.
- UP = Intermediate-term uptrend. Set when I see at least one higher high and higher low on weekly chart.
- DOWN = Intermediate-term downtrend. Set when I see at least one lower high and lower low on weekly chart.


