|
||||||||||||||||||||||||
|
||||||||||||||||||||||||
|
||||||||||||||||||||||||
|
SHORT-TERM: COULD SEE REBOUND TOMORROW BUT I EXPECT A 2ND LEG DOWN THEREAFTER
No conclusion today, need see how market rebounds tomorrow. There’re 3 times recently when SPX had a pullback larger than 20 points which if per normal pattern, the pullback shall become larger and larger, then chances are pretty good that this time we’ll have a 2 leg down after a rebound tomorrow. Of course, since the market nowadays is very very bullish, plus VIX is now way above BB and MA ENV(10, 20) top (attention, it’s 20% above MA10 not just 10% above MA10 which is nothing), so I cannot exclude the possibility that the market was bottomed today like what happened the previous 2 times that had no 2nd leg down. Personally, I’m now (subject to change at any time of course) inclined to believe that this time we’ll have a 2nd leg down at least.
Charts below are my witnesses for a green day tomorrow:
VIX rose 18%+ on a single day, buy SPX at close and sell at the next day’s close since year 2000, you have 81% chances for tomorrow.
36 out of 54 times (67%) a green day the next day after a Major Distribution Day (NYSE Down Volume : NYSE Up Volume >= 9).
Charts below are my reasoning for a short-term bottom (at least):
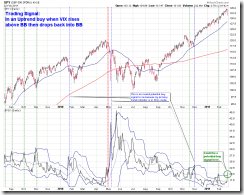
6.2.2b VIX Trading Signal (BB), 6.2.0a VIX Trading Signals (ENV), VIX out of BB top or MA ENV(10, 20) is a potential buy setup.
Seems like the market was bottomed whenever VIX:VXV > 0.9 recently.
INTERMEDIATE-TERM: COULD BE NO 2.5%+ PULLBACK FOR 85 MORE TRADING DAYS, BEARS MAY WAIT ANOTHER WEEK, BUT DON’T HOPE TOO MUCH
See 02/18 Market Recap for more details.
SEASONALITY: BEARISH THE NEXT WEEK
See 02/18 Market Recap for more details.
HIGHLIGHTS OF THE OTHER ETFS IN MY PUBLIC CHART LIST
| SIGNAL | COMMENT | |
| QQQQ | 01/28 S | |
| NDX Weekly | UP | |
| IWM | ||
| IWM Weekly | UP | |
| CHINA | ||
| CHINA Weekly | UP | No higher low yet but the rebound is so strong so could be in uptrend now. |
| EEM | ||
| EEM Weekly | DOWN | |
| XIU.TO | 02/04 L | TOADV MA(10) is a little too high, all led to a pullback of some kind recently. |
| XIU.TO Weekly | UP | Too far above MA(200), %B too high. |
| TLT | *Could be a channel breakout, trend may about to change. | |
| TLT Weekly | DOWN | |
| FXE | ||
| FXE Weekly | UP | |
| GLD | ||
| GLD Weekly | UP | |
| GDX | 02/03 L | |
| GDX Weekly | UP | |
| USO | *Breakout? See WTIC below. | |
| WTIC Weekly | UP | |
| XLE | 02/09 S | |
| XLE Weekly | UP | Too far above MA(200). |
| XLF | 10/15 L | |
| XLF Weekly | UP | |
| IYR | ||
| IYR Weekly | UP | |
| XLB | 02/09 S | *Testing trend line. |
| XLB Weekly | UP | BPMATE is way too overbought. |
- Please make sure you understand how to use the table above. The purpose of this report is to provide info so contradictory signals are always presented.
- Conclusions can be confirmed endlessly, but trading wise, you have to take actions at certain risk level as soon as you feel the confirmation is enough. There’s no way for me to adapt to different risk levels therefore no trading signals will be given in this report except the mechanical signals such as SPY ST Model.
- * = New update; Blue Text = Link to a chart in my public chart list.
- Trading signals in OTHER ETFs table are mechanical signals. See HERE for back test results. 08/31 L, for example, means Long on 08/31.
- UP = Intermediate-term uptrend. Set when I see at least one higher high and higher low on daily chart.
- DOWN = Intermediate-term downtrend. Set when I see at least one lower high and lower low on daily chart.


