|
||||||||||||||||||||||||
|
||||||||||||||||||||||||
|
SHORT-TERM: 67% CHANCES A GREEN DAY TOMORROW; NOT SURE IF THE LOW WAS IN, POSSIBLY THOUGH
Three cents:
- 67% chances a green day tomorrow.
- Cannot exclude the possibilities that the low was in.
- Trading wise, I’ll sell the very first bounce. As of today’s close, Cobra Impulse System becomes the bear officially. This is the system’s golden voyage, so wish it really gets lucky here. I’ve put the chart in today’s After Bell Quick Summary and kind of thinking of putting all the other trading signals into After Bell Quick Summary thereafter and rename the After Bell Quick Summary to Trading Report which will concentrate only on trading signals and related topics. The Market Recap will be renamed to Market Outlook and all about analysis only, with no single trading mentioned.
Why 67% chances a green day tomorrow? Surprisingly, the sell volume surged in the last 15 minutes and the day eventually turned into a Major Distribution Day (NYSE Down Volume : NYSE Up Volume > 9) before I noticed much much later. The next day after a Major Distribution Day had 67% chances of being a green day. As for why the day became a Major Distribution Day in the last 15 minutes? Well, it is suspicious, but since I never paid attention to this kind of last 15 minutes Major Distribution Day, so guess I’d better not to put too much of my suspicion here.
Why cannot exclude the possibilities that the low was in?
- RSP still shows now lower low which means the selling today was mainly due to some heavy weighted stocks, since it’s not a broad based selling, so the seriousness of today’s selling is suspicious. Besides the RSI positive divergence looks bullish.
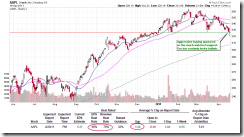
- QQQ hollow red bar looks bullish too. If you’ve noticed the AAPL chart, you’d understand what’s going on today. People were buying aggressively when AAPL touched an important support because everyone in this planet Earth knows that the AAPL ER won’t be bad which is due in 04/20 AH. So chances are good that AAPL will keep rising from here and therefore the broad market may rebound to 04/20 at least.
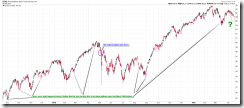
- The last but not the least, let me remind you of the bullish seasonality for the rest of the shortened week. See 04/15 Market Recap. The screenshot below is from Bespoke.
INTERMEDIATE-TERM: BULLISH APRIL, SPX TARGET 1352 TO 1381, BEWARE 04/11 TO 04/14 PIVOT DATE
See 04/01 Market Recap for more details.
SEASONALITY: MIXED
See 04/15 Market Recap for more details.
HIGHLIGHTS OF THE OTHER ETFS IN MY PUBLIC CHART LIST
| TREND | COMMENT | |
| QQQ & Weekly | UP | |
| IWM & Weekly | UP | |
| SSEC & Weekly | UP | |
| EEM & Weekly | UP | |
| XIU & Weekly | DOWN | *Hollow red bar, so rebound? |
| TLT & Weekly | UP | |
| FXE & Weekly | UP | |
| GLD & Weekly | UP | |
| GDX & Weekly | *04/18 L | |
| USO & Weekly | UP | |
| XLE & Weekly | UP | |
| XLF & Weekly | DOWN | |
| IYR & Weekly | UP | |
| XLB & Weekly | UP | |
| DBA & Weekly | DOWN |
- Please make sure you understand how to use the table above. The purpose of this report is to provide info so contradictory signals are always presented.
- * = New update; Blue Text = Link to a chart in my public chart list.
- UP = Intermediate-term uptrend. Set when weekly buy signal is triggered.
- DOWN = Intermediate-term downtrend. Set when weekly sell signal is triggered.


