SHORT-TERM: EXPECT PULLBACK AS EARLY AS TOMORROW
Two cents:
- Could see a pullback as early as tomorrow.
- Pullback, if any, is a buy opportunity because normally at least today’s high will be retested before a real big pullback could be possible.
For 4 reasons I’m calling a pullback as early as tomorrow:
- SPX close above BB top for 2 consecutive days, short at today’s close cover on the very first day when SPX close below BB top since 2003, you’ve got 83% chances.
- T2112 is a little high. Not as extreme as before but since now lots of stocks are at very high level so the current T2112 readings should be extreme enough. At least so far this year whenever T2122 reached the current level, SPX had a pullback of some kind thereafter (See blue curve in the background).
- 1.0.0 S&P 500 SPDRs (SPY 60 min), 3 push up plus overshot plus a little high ChiOsc, so at least we’ll see some weakness tomorrow morning.
INTERMEDIATE-TERM: SPX NOW IN 1352 TO 1381 WAVE 5 PRICE TARGET AREA, WATCH FOR POTENTIAL REVERSAL
SPX now officially entered into the wave 5 price target area I mentioned in 04/01 Market Recap and 04/21 Market Recap. If it reverses hard within the area, then we should be careful about the possibility of primary wave 3 down (sharply). For now, I don’t have any solid evidences for calling the primary wave 3 down but neither can 100% guarantee that the market will skyrocket high from here, so we’ll have to wait and see. Just want you to know that we are at a critical area.
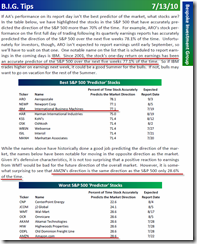
Remember I mentioned that IBM down on ER is a bad sign? Well, AMZN up today on ER is, unfortunately, a bad sign too. The screenshot below is from Bespoke. Although the data is not up to date, but my impression is both IBM and AMZN recent ER did predict the SPX price the same way as described in the screenshot below.
SEASONALITY: BEARISH MONDAY, THURSDAY AND FRIDAY, BULLISH WEDNESDAY
See 04/21 Market Recap for more details.
ACTIVE BULLISH OUTLOOKS:
- 09/27 Market Recap: 9 POMO within 20 trading days means 14%+ up in 3 months.
02/23 Market Recap: Pullback could last 4 weeks, then 02/18 highs will be revisited.- 03/11 Market Recap: Bullish in 3 to 6 months.
- 04/01 Market Recap: Bullish April.
- 04/21 Market Recap: QQQ weekly Bullish Engulfing is bullish for the next 6 weeks.
ACTIVE BEARISH OUTLOOKS:
03/18 Market Recap: 03/16 lows will be revisited.Failed!- 04/21 Market Recap: SPX will close below 04/20 close soon.
- 04/27 Market Outlook: IBM down on ER and AMZN up on ER mean lower SPX price in 5 weeks.
HIGHLIGHTS OF THE OTHER ETFS IN MY PUBLIC CHART LIST:
|
||||||||||||||||||||||||||||||||||||||||||||||||||||||||||||
|


