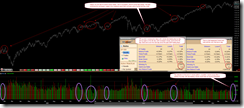
SHORT-TERM: MAY SEE A PULLBACK OF SOME KIND AHEAD
One chart says all today, take a look yourself. See volume pattern illustrated in the chart below, today’s bar could be an exhaustion bar, so either 71% chances a red day tomorrow or 93% chances SPX will close below today’s close soon, and see red cycles, with no exception recently, the pullback may last for a few days. Also don’t forget all the recent statistics below:
- As mentioned in 05/24 Market Outlook, 70% chances SPX will close below 05/24 close.
- As mentioned in 05/26 Market Outlook, 69% chances SPX will close below 05/26 close.
- As mentioned in 05/27 Market Outlook, 93% chances SPX will close below 05/27 close.
I would be speechless if all those statistics fail eventually. That said, since nowadays the most impossible thing is actually the most possible thing, so frankly, I have no confidence at all for bears. Anyway, put emotion aside, I’ll, for now, accordingly, maintain what I blah blah in 05/27 Market Outlook – bullish, yes, but not without a fight. Let’s see…
INTERMEDIATE-TERM: MAY SEE NEW HIGH, TARGETING SPX 1352 to 1381 AREA, BIG CORRECTION MAY FOLLOW AFTER THAT
See 05/27 Market Outlook for more details.
SEASONALITY: BULLISH TUESDAY, WEDNESDAY AND THE ENTIRE WEEK
According to Stock Trader’s Almanac:
- Day after Memorial Day, Dow up 8 of last 11.
- First trading day in June, Dow up 10 of last 12, 2002 –2.2%, 2008 –1.1%.
- Memorial Day week Dow down 7 of last 14, up 12 straight 1984-1995.
Also see 05/20 Market Outlook, Memorial Day week, positive 64% of the time.
For May seasonality day by day please refer 04/29 Market Outlook.
ACTIVE BULLISH SIGNALS:
- 0.2.1 10Y T-Bill Yield: ROC(30) < –9, so bottomed?
0.1.1 SPX Intermediate-term Trading Signals: CPCEMA(10) too low, so a bottom is close.
ACTIVE BEARISH SIGNALS:
4.0.1 SPX Long-term Trading Signals: WeeklyEMA(13) is too far aboveEMA(34).- 4.0.7a Collection of Leading Indicators I: Negative divergences become too much and too big.
- 8.1.1 Normalized NATV/NYTV: Too high, so topped?
0.2.4 Nasdaq Total Volume/NYSE Total Volume: New recovery high, so topped?
ACTIVE BULLISH OUTLOOKS:
- 09/27 Market Recap: 9 POMO within 20 trading days means 14%+ up in 3 months.
- 03/11 Market Recap: Bullish in 3 to 6 months.
- 04/21 Market Recap: QQQ weekly Bullish Engulfing is bullish for the next 6 weeks.
- 05/27 Market Outlook: II Correction % too high, so should be a new high ahead then followed by a real correction.
ACTIVE BEARISH OUTLOOKS:
05/20 Market Outlook: A little bearish next week, either close in red or drops below SPX 1318.- 05/27 Market Outlook: May revisit 05/25 lows the next week, at least a dip of some kind.
HIGHLIGHTS OF THE OTHER ETFS IN MY PUBLIC CHART LIST:
|
||||||||||||||||||||||||||||||||||||||||||||||||
|

