SHORT-TERM: THE SELLING IS NOT OVER YET
Most likely the selling isn’t over yet. The chart below shows a possible (and NORMAL) bullish case where a lower low is still needed before any meaningful rebound is possible.
About tomorrow’s Non Farm Payroll day, two things for your attention:
- General bullish and more likely a pivot point.
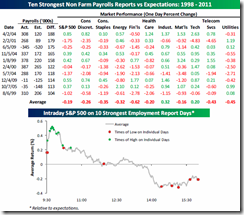
- Intraday pattern usually is to open high goes lower or to open low goes higher. The statistics below is from Bespoke. Also according to Bespoke, it seems that the job data won’t be bad tomorrow? See Biggest ADP Payroll Misses and Subsequent Nonfarm Payrolls Results.
About Cobra Impulse System, forgot to mention in today’s Trading Signals: There’s potential buy setup, but need a higher high and green day tomorrow to confirm.
INTERMEDIATE-TERM: MAY SEE NEW HIGH, TARGETING SPX 1352 to 1381 AREA, BIG CORRECTION MAY FOLLOW AFTER THAT
See 05/27 Market Outlook for more details.
SEASONALITY: BULLISH TUESDAY, WEDNESDAY AND THE ENTIRE WEEK
See 05/27 Market Outlook for more details.
Also see 06/01 Market Outlook for June day to day seasonality.
ACTIVE BULLISH SIGNALS:
- 0.2.1 10Y T-Bill Yield: ROC(30) < –9, so bottomed?
ACTIVE BEARISH SIGNALS:
- 4.0.7a Collection of Leading Indicators I: Negative divergences become too much and too big.
- 8.1.1 Normalized NATV/NYTV: Too high, so topped?
ACTIVE BULLISH OUTLOOKS:
- 09/27 Market Recap: 9 POMO within 20 trading days means 14%+ up in 3 months.
- 03/11 Market Recap: Bullish in 3 to 6 months.
- 04/21 Market Recap: QQQ weekly Bullish Engulfing is bullish for the next 6 weeks.
- 05/27 Market Outlook: II Correction % too high, so should be a new high ahead then followed by a real correction.
ACTIVE BEARISH OUTLOOKS:
05/27 Market Outlook: May revisit 05/25 lows the next week, at least a dip of some kind.
HIGHLIGHTS OF THE OTHER ETFS IN MY PUBLIC CHART LIST:
|
||||||||||||||||||||||||||||||||||||||||||||||||
|


