SHORT-TERM: LOWER LOW AHEAD
Two conclusions:
- It’s rare the Friday’s low was the low although I still believe we’ll have a sizeable rebound (See 08/18 Market Outlook) no later than the next Tuesday.
- SPX downside target at 1,000, the correction may last 1 to 2 months on average. I’ll discuss this in the intermediate-term session.
Why is it rare the Friday’s low was the low?
- VIX rose 30% within 2 days, there’re only 3 out of 25 cases since 1990, the Friday’s low was the low. Check from 8.3.4a VIX Rose 30% in 2 Days – 1990 to 8.3.4g VIX Rose 30% in 2 Days – 2010 for all the past cases.
- Red OE week this week, so 80% chances, either red the next week or at least a lower low first.
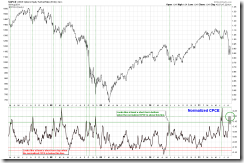
Below is just to acknowledge that i do see the unusual high of Normalized CPC and CPCE, therefore at least a short-term bottom should be very close now. Just I don’t see any of my ultimate weapons for watching oversold are near extreme level yet, so I don’t believe it’s the time to do the bottom fish. Well, even it’s the time, I’ll just do the talk here as you all know that I never front run the market.
INTERMEDIATE-TERM: SPX DOWNSIDE TARGET IS 1,000, THE CORRECTION COULD LAST 1 TO 2 MONTHS
In 08/05 Market Outlook, I mentioned the SPX downside target would be the monthly BB bottom which is around 1,000 for now. I didn’t have any solid evidences at that time therefore it was just a concept. Now, because of the statistics from Bespoke and Schaeffer below, I officially call for SPX downside target at 1,000 and the correction could last 1 to 2 months on average.
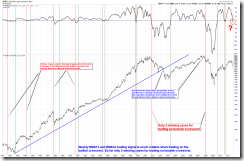
The chart below is info only as many people use SPX weekly EMA13 and EMA34 bearish crossover as the long term sell signal which was clearly triggered this week. Historically thought, such a sell signal mostly didn’t work. The long term signal I like the most FOR NOW is 4.9.1 TSX Long Term Trading Signals which also applies to SPX as well and which issued sell signal at the end of July. Click the link to see the chart yourself. I’ll explain the idea (of long term investment for your 401K or RRSP) in another post later.
SEASONALITY: NO UPDATE
Please see 07/29 Market Outlook for day to day August seasonality chart.
ACTIVE BULLISH OUTLOOKS:
- 08/18 Market Outlook: Relief rally could be within 3 trading days.
ACTIVE BEARISH OUTLOOKS:
08/02 Market Outlook,08/05 Market Outlook,08/08 Market Outlook,08/09 Market Outlook: Rebound, if any, is sell.
SUMMARY OF SIGNALS FOR MY PUBLIC CHART LIST:
|
|||||||||||||||||||||||||||||||||||||||||||||
|
|||||||||||||||||||||||||||||||||||||||||||||
|


