SHORT-TERM: IN WAIT AND SEE MODE
No conclusion today, need see tomorrow. Although I don’t believe we’ll have QE3 but it’s really hard to say what the market responses will be.
Two things need clarify here:
- As mentioned in today’s Trading Signals, a day like today, gap up open then higher high but close in red eventually (so called Bearish Reversal Day), most likely means at least a short-term top is around. I certainly don’t mean a red day tomorrow because from the chart below, clearly there’re lots of cases where the market was up huge after such a Bearish Reversal Day (blue arrow cases), even it’s the red arrow case, the market may still go up a little for a few days, so it’s just a sign, more precisely a bad sign, but we need see how market follow through in the following days. Considering the statistics I provided in the yesterday’s report about the Non-Stop model which argues for a higher close head, therefore I cannot exclude that we’ll repeat blue arrow cases here, that the market simply keeps going up huge thereafter.
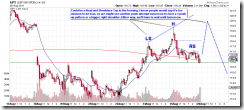
- Chart pattern wise, could be a Head and Shoulders Top in the forming, but it’s more likely today’s high gets tested tomorrow to form a 3 push up pattern before any meaningful pullback. The real question needs to answer here is why insisting a pullback? That’s because the pullback on Aug 24 was larger than that of Aug 23 while the pullback today (Aug 25) was larger than that of Aug 24, apparently bears are getting stronger and stronger as the pullback becomes larger and larger, so more likely, the next pullback, if any, would be larger than that of Aug 25.
The charts below explains why my tone tonight sounds not bearish:
- Normalized NATV:NYTV is way too low, which usually means a bottom of some kind.
- Normalized CPC is still too high, which also means a bottom.
INTERMEDIATE-TERM: SPX DOWNSIDE TARGET IS 1,000, THE CORRECTION COULD LAST 1 TO 2 MONTHS
See 08/19 Market Outlook for more details.
SEASONALITY: NO UPDATE
Please see 07/29 Market Outlook for day to day August seasonality chart.
ACTIVE BULLISH OUTLOOKS:
08/18 Market Outlook: Relief rally could be within 3 trading days.
ACTIVE BEARISH OUTLOOKS:
- N/A
SUMMARY OF SIGNALS FOR MY PUBLIC CHART LIST:
|
|||||||||||||||||||||||||||||||||||||||||||||
|
|||||||||||||||||||||||||||||||||||||||||||||
|


