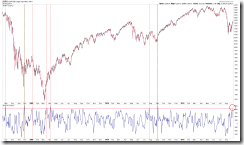
SHORT-TERM: COULD SEE PULLBACK TOMORROW
The market is overbought so could see pullback tomorrow. From the VIX chart below there’re some chances the top was in, just a single evidence is far from enough to draw any solid conclusion so I need see the next few days.
Three charts below are arguing for a red tomorrow, among them T2122 and NYMO are my ultimate weapons for watching overbought/oversold, should be pretty reliable.
INTERMEDIATE-TERM: SPX DOWNSIDE TARGET IS 1,000, THE CORRECTION COULD LAST 1 TO 2 MONTHS
See 08/19 Market Outlook for more details.
SEASONALITY: BEARISH TUESDAY, BULLISH THURSDAY
According to Stock Trader’s Almanac:
- August’s next-to-last trading day, S&P up only twice in last 14 years.
- First trading day in September, S&P up 11 of last 15, back-to-back huge gains 1997 and 1998, up 3.1% and 3.9%.
Also please see 07/29 Market Outlook for day to day August seasonality chart.
ACTIVE BULLISH OUTLOOKS:
- N/A
ACTIVE BEARISH OUTLOOKS:
- N/A
SUMMARY OF SIGNALS FOR MY PUBLIC CHART LIST:
|
|||||||||||||||||||||||||||||||||||||||||||||
|
|||||||||||||||||||||||||||||||||||||||||||||
|


